Skip to content

Homelab Twin · 3D rack planner

Your homelab rack, in 3D.

Drop in a spreadsheet of your gear. See what every device draws and costs, what's plugged where, and what goes dark when one thing fails.

Try it free — coming when we open the doors; get notified. Your file is read in your browser and never uploaded.

Basement Lab
View: Overview
Lights
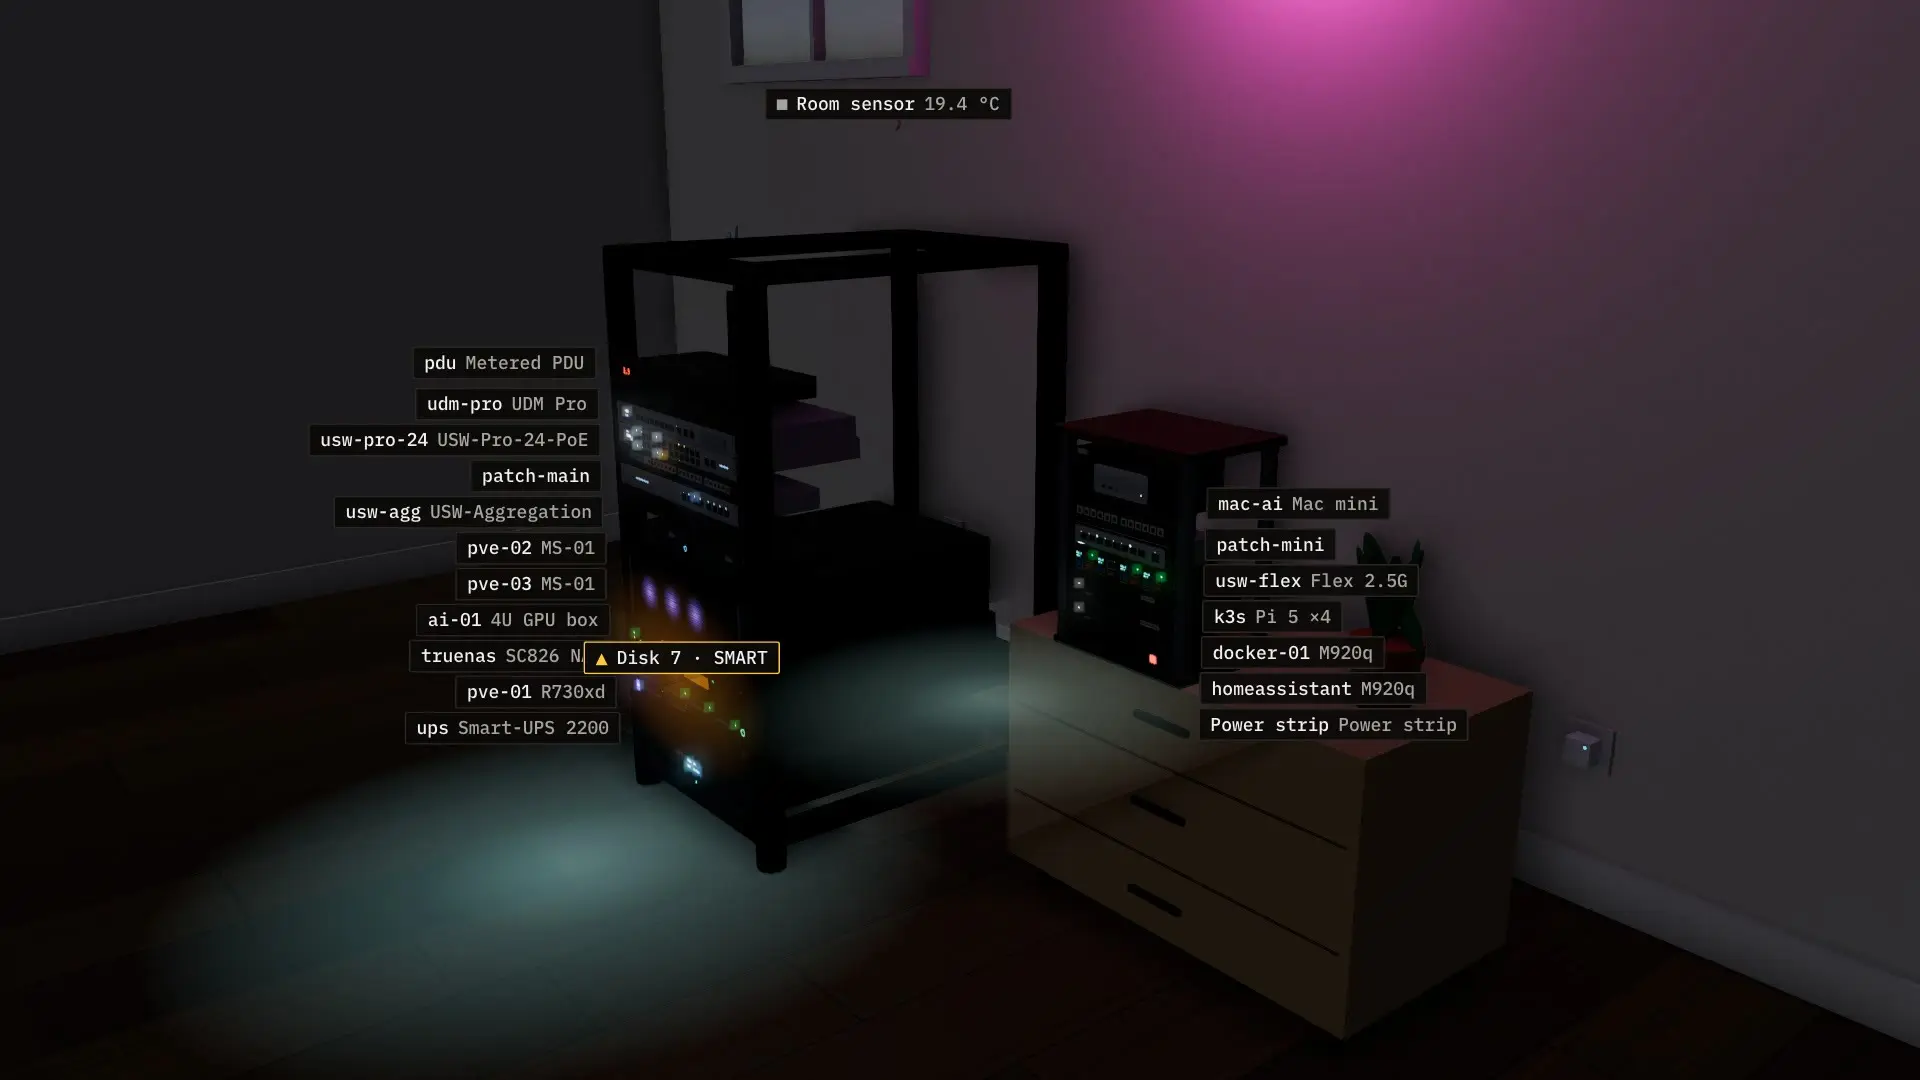
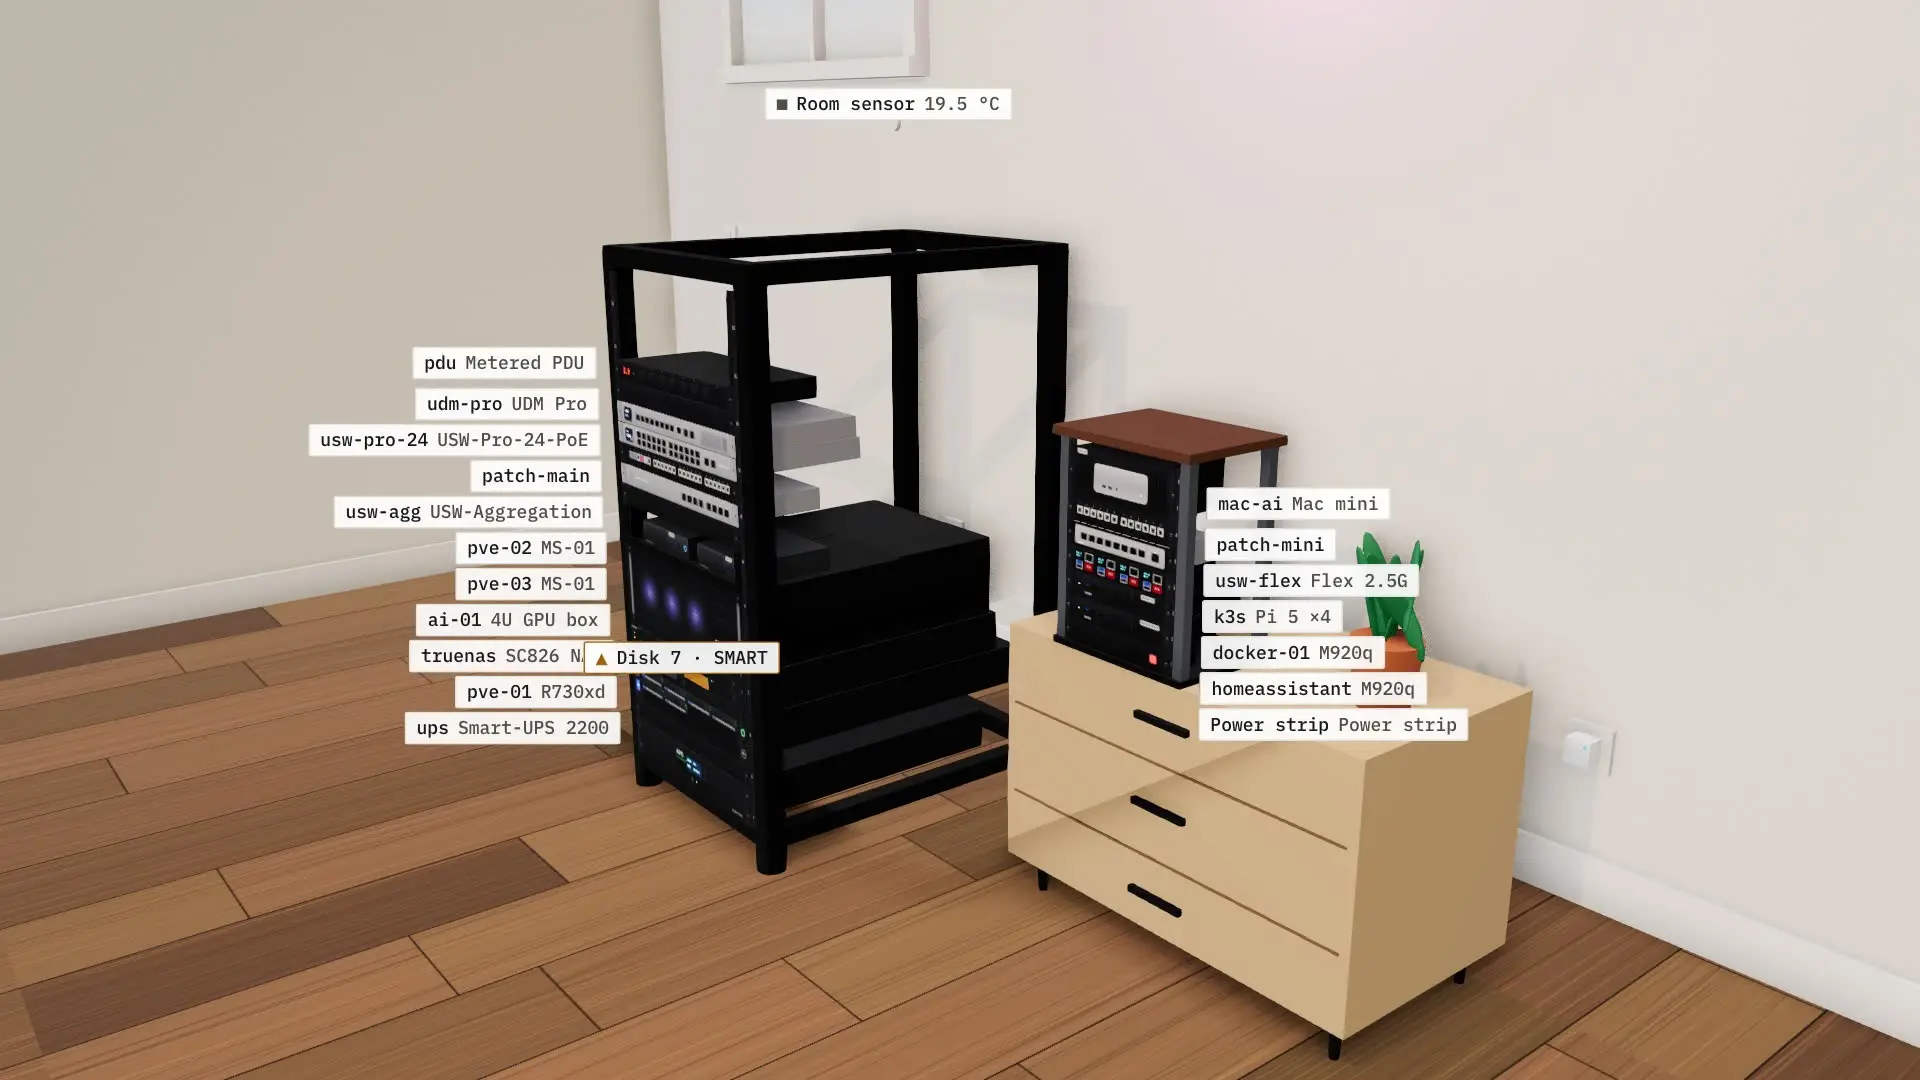
The demo lab in 3D with the room lights off: device LEDs and screens glow, the readout shows 1.02 kW and €165 a monthThe demo lab in 3D with the room lights on, in a bright office
1.02 kW now€165 / month18 min on UPS16 issues founddemo · simulated data

Recorded from the app. Every control here swaps a clip.

Lights-out closet

−145W

−€34 / month

Room light off, rack still running. Homelab Twin counts the light as a load like any other and shows the saving next to the watts. estimated

What it shows

What Homelab Twin shows you

POWER

What it costs

Watts per device and money per month at your electricity price, estimated from each model and any readings you add. Follow the power from the wall through the UPS and power strip to every device, with the load on each step.

wall → UPS → power strip → device · load %
NETWORK

What's plugged where

Router to switch to device, port by port, in 3D or as a clean diagram. On Pro, trace every cable at the back of the rack from end to end, through the patch panel.

ISP → router → switch → device · speed · PoE
FAIL

What goes dark

Click the UPS, a power strip or a switch and press Fail. Homelab Twin shows what loses power or network, and what keeps running. In every plan.

Fail → what goes dark

How it works

From spreadsheet to 3D rack, in your browser.

  1. 01

    Get the template

    Or start from the Basement Lab example.

  2. 02

    Fill in Devices

    Rack, U and model are the only required columns. Add cables, power and readings when you want more.

  3. 03

    Drop the file in

    You get an import report and your rack in 3D. Unknown models still show up, as plain boxes of the right height.

.xlsx, or one CSV per sheet. The file never leaves your machine.

Views

One rack, seen several ways.

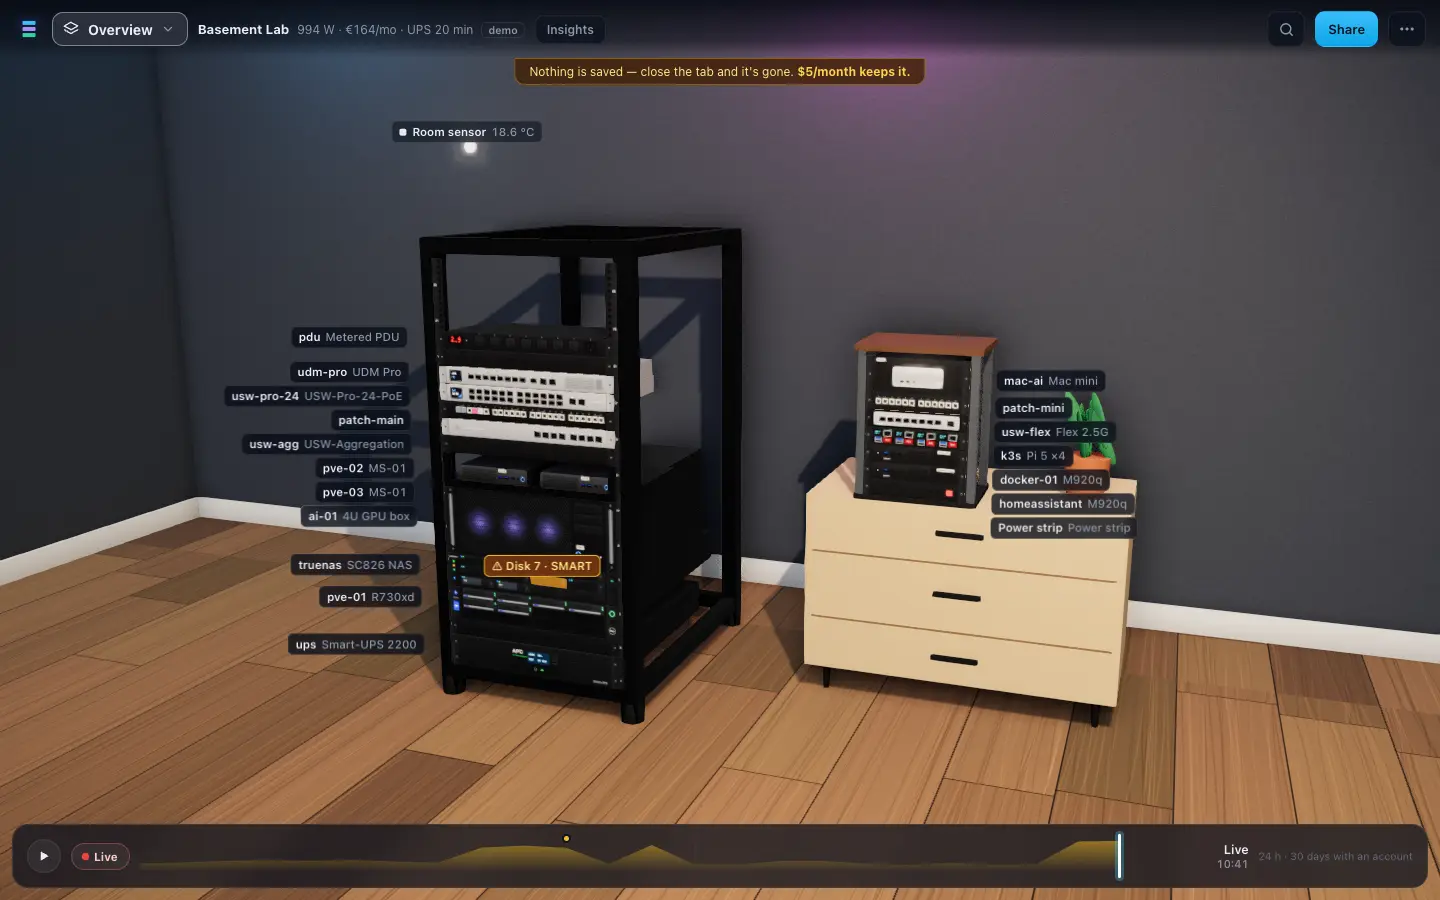
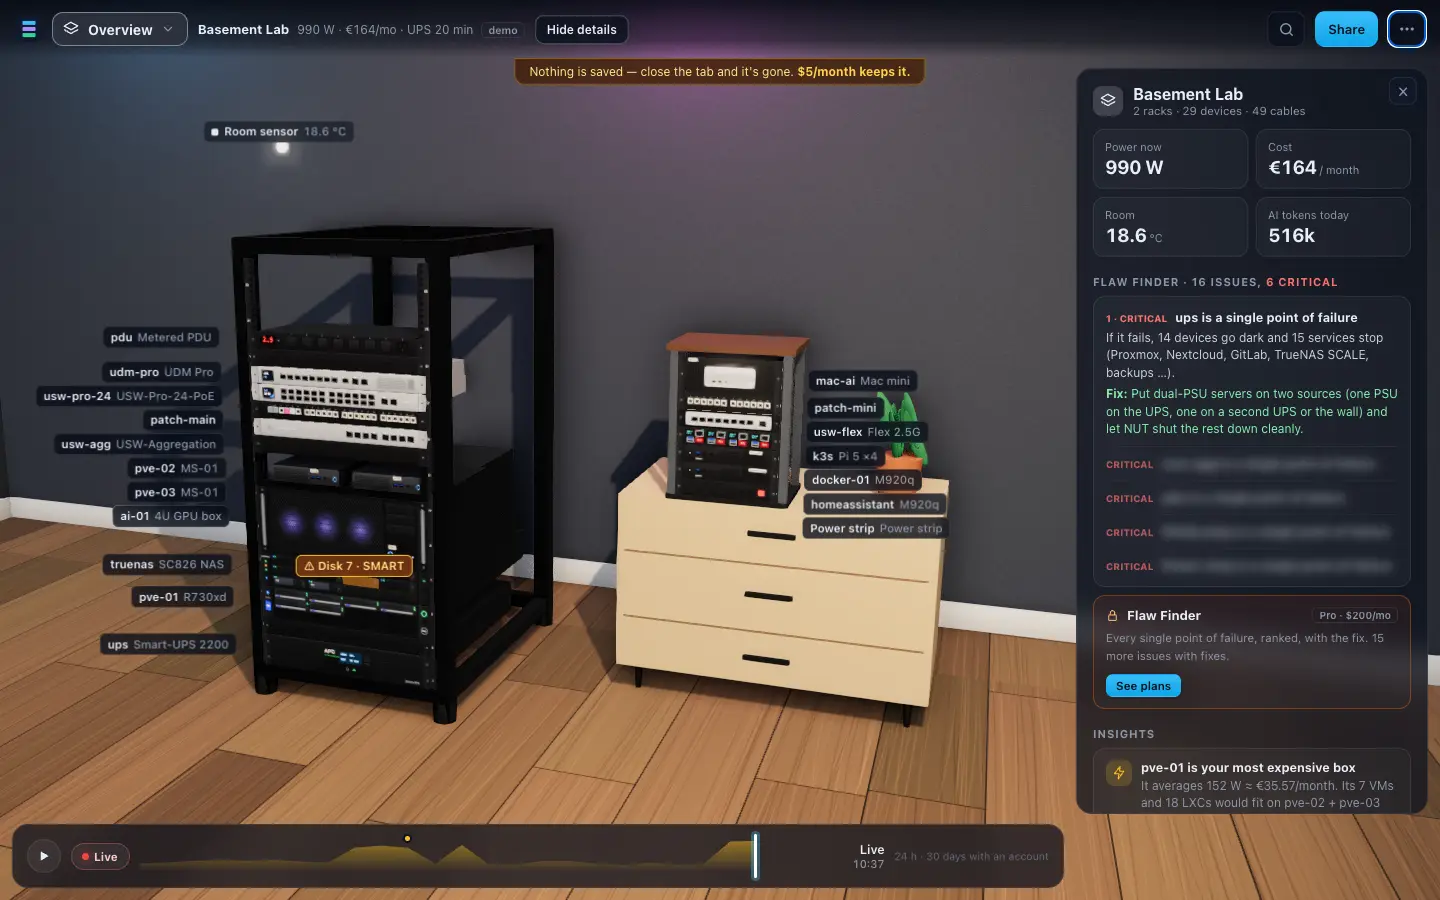
The whole lab at a glance: racks, devices, and the gear outside the rack. One readout on top: watts, cost per month, UPS runtime.

Overview· simulated data
The demo lab in 3D: two racks with labelled devices, a power and cost readout at the top and the timeline at the bottom

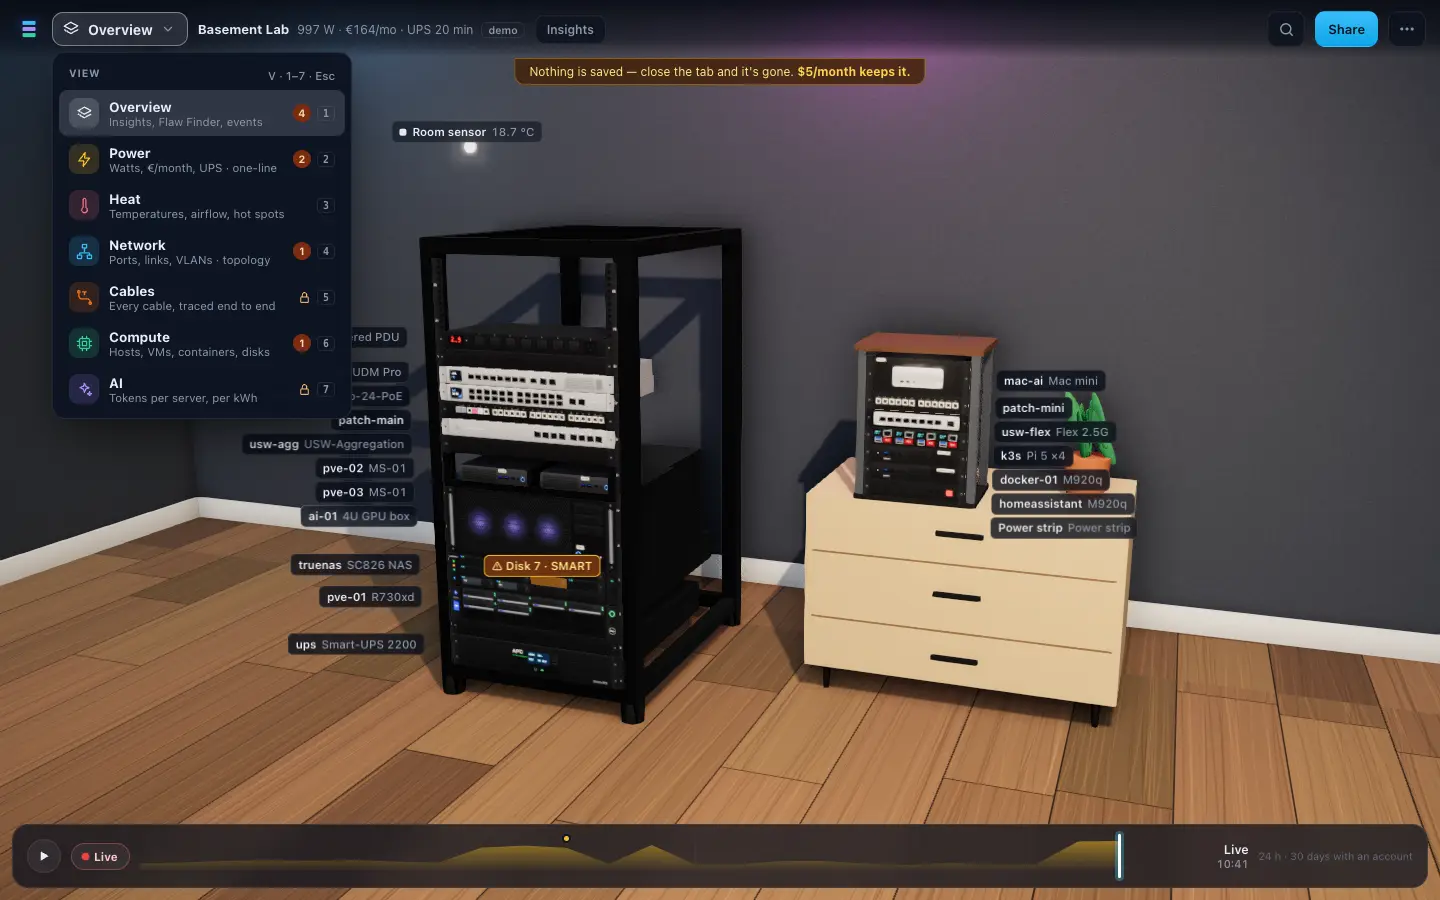
Overview, Power, Heat, Network, Cables, Compute and AI sit in one View menu (keys 1–7). Power and Network switch between 3D and a diagram.

Views· simulated data
The View menu open over the demo lab, listing Overview, Power, Heat, Network, Cables, Compute and AI

Single points of failure, overloaded strips, UPS runtime at peak and more, ranked with the fix. Try runs it once and opens the first issue.

Flaw Finder· simulated data
Flaw Finder panel over the demo lab: the UPS is a single point of failure, with the devices that go dark and the fix

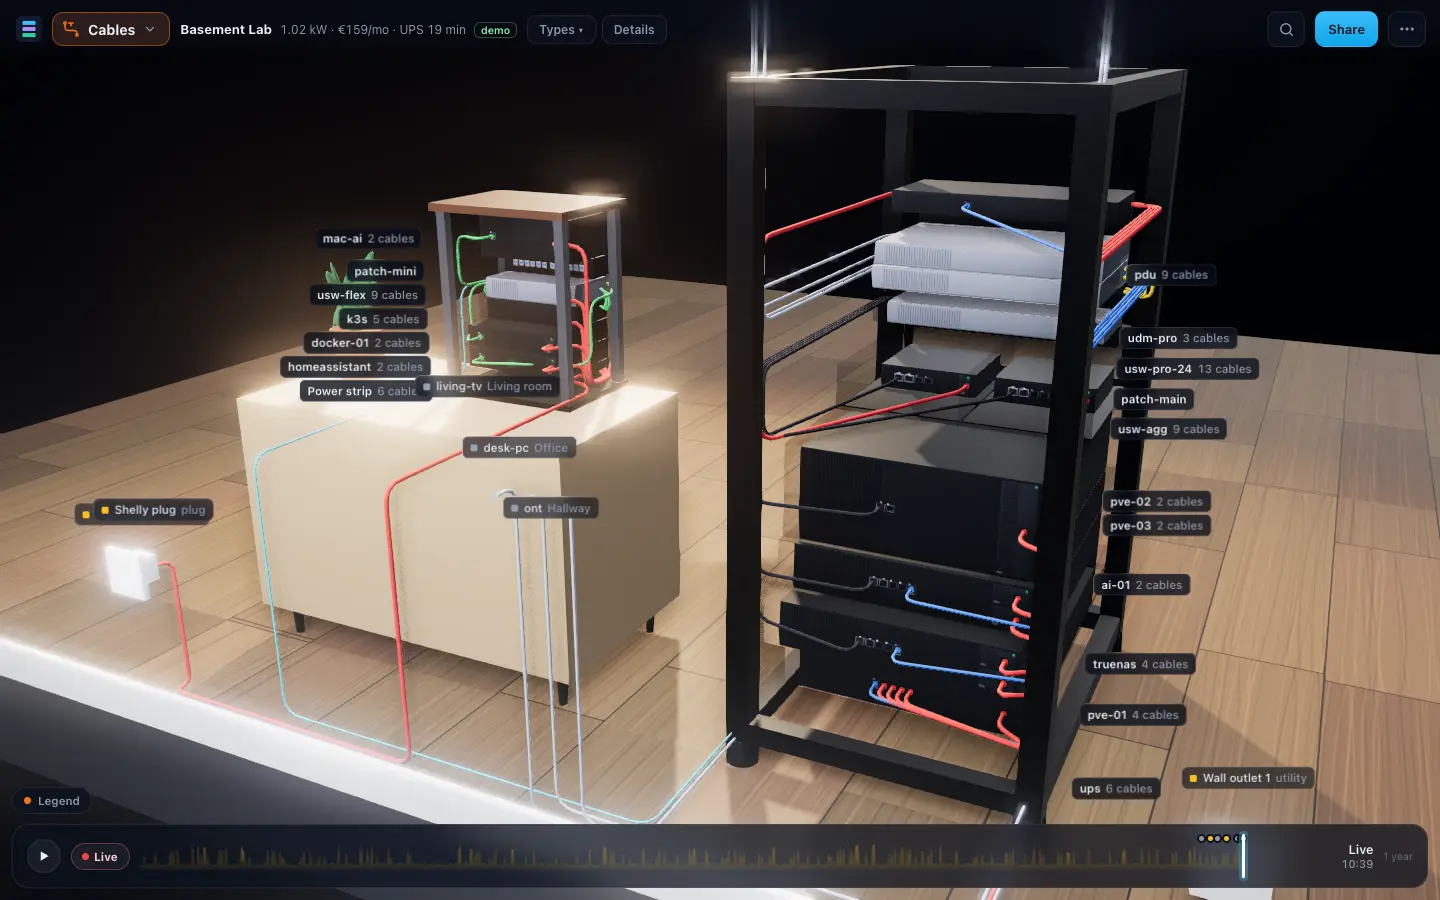
Every cable at the rear of the rack, coloured by type and traced end to end through patch panels.

Cables· simulated data
Cables view: power and network cables drawn at the back of both racks, with a cable count per device

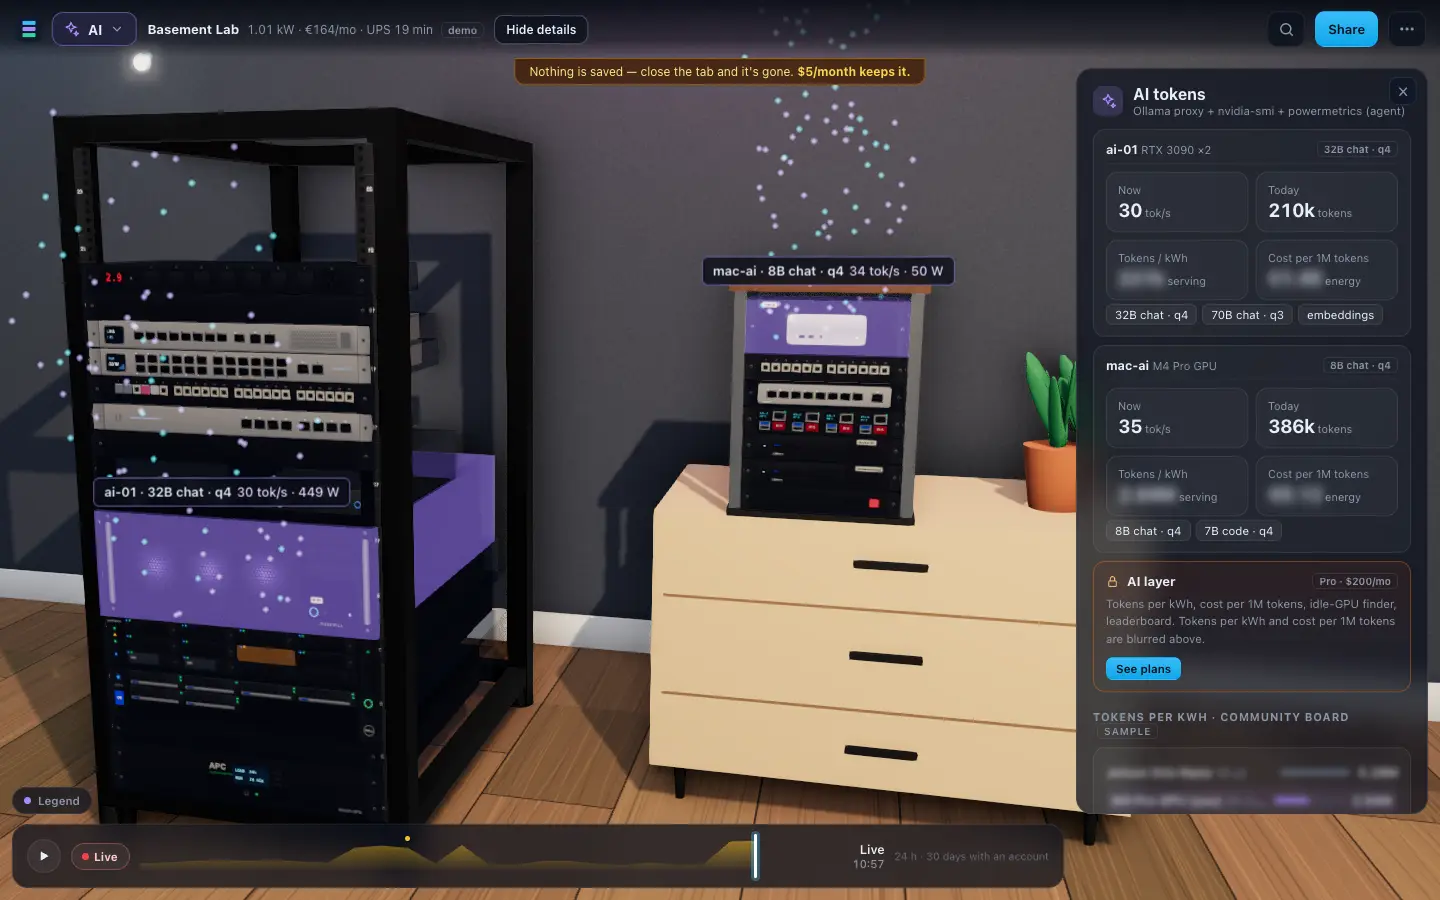
Tokens per second for the AI box in your rack; tokens per kWh and cost per million tokens on Pro.

AI· simulated data
AI view: tokens per second per AI box, with tokens per kWh blurred as a Pro preview

Checks

It reads your sheet like a second pair of eyes.

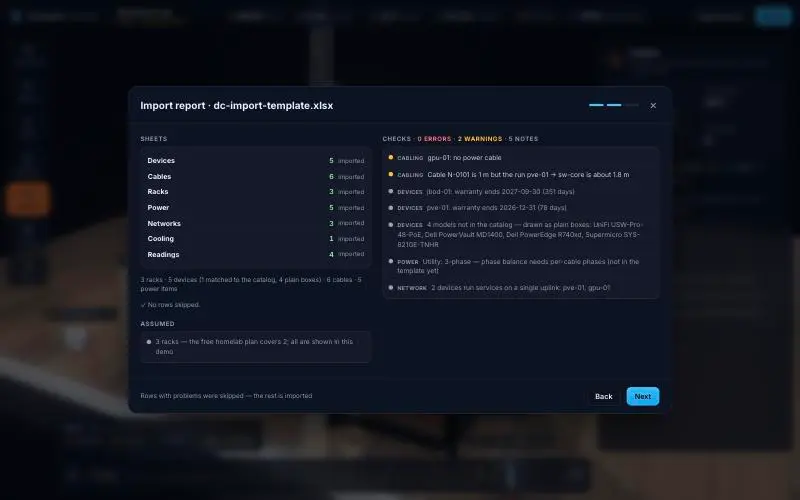
Every import ends with a report: rows imported, rows skipped (with the reason), and checks pinned on the rack.

  • Two devices in the same U
  • A port used twice
  • 10G on a 1G port, or fiber into RJ45
  • Both power supplies on the same feed
  • A power strip over 80 % of its rating
  • UPS runtime under 5 minutes
  • A cable shorter than its run
  • Missing labels, undefined VLANs, port errors
Import report· simulated data
Import report of the template file: sheets imported, checks with errors, warnings and notes
Share · video· simulated data

Share

Post your rack.

Every lab gets a ready-made share card (1200×630), a clean rack-elevation PNG, and an animated share: a short GIF for forums and a video of your rack with the LEDs blinking and the power and network flowing.

AI

Tokens per kWh, for the AI box in your rack.

Tokens per second tells you how fast it is. Tokens per kWh tells you what it costs. Homelab Twin puts both on the rack, next to the watts.

Work out your tokens per watt with the free calculator →

The AI view's tokens per kWh is part of Pro. The calculator is free.

Tokens today719kBasement Lab · demo
Tokens / kWhPro

Pricing

Free to try. Pay to keep it.

Compare plans →
TryFreeNo account, nothing stored. Not public yet: see it or book a walkthrough.
Account Launching soon$5 / monthor $50/year. Keep your lab.
Pro Launching soon$20 / monthor $200/year. Cables, AI and the full toolkit.

Built by data-center people. Homelab Twin comes from a team that builds 3D models of full data centers, scaled down to the rack in your basement. In partnership with Sensaka.

Questions

Is Homelab Twin free?

Try will be free, with no account and nothing stored. It isn't public yet: for now we show the app in clips, stills and walkthroughs. Account ($5/month or $50/year) keeps your lab; Pro ($20/month or $200/year) adds cable tracing, tokens per kWh, the full Flaw Finder and reports. Account and Pro are launching soon.

Can I try it now?

Not on your own yet. Watch the clips on the See it page, or request a walkthrough and we show you the app on a short call. Meanwhile the import template is free to download and fill in.

Do I need to install anything?

No. It runs in your browser and imports a spreadsheet: the template, or one CSV per sheet. Only the Devices sheet is required (rack, U and model).

Is my file uploaded?

No. The spreadsheet is read in your browser and never leaves your machine. Without an account nothing is stored: no cookies, no browser storage, and no requests to third parties.

How accurate are the power and cost numbers?

They are estimates: each device's typical draw from its model, adjusted by any readings you add to the Readings sheet, times your electricity price. For exact numbers, add readings from a smart plug or your UPS.

What racks does it handle?

One or two racks, including 10-inch mini racks. Gear outside the rack, such as access points, cameras or the ISP box, can be placed too: leave the U column empty.

What's tokens per kWh?

How many AI tokens your hardware produces per kilowatt-hour of electricity. It is the efficiency number for a home AI box, the way miles per gallon is for a car.

See your rack in 3D.

No account = we store nothing. $5/month keeps it.