

Both layers run on the demo rooms and on any file you import.
Connectivity layers: Cabling · Network
The connectivity layers come from one sheet: Cables. Each row is one cable, from device and port to device and port, with type, media, speed, length and route. From that DC Sim draws every run through the rack and the trays in 3D, builds the network topology automatically, and lets you cut a cable or fail a switch to see who loses connectivity.
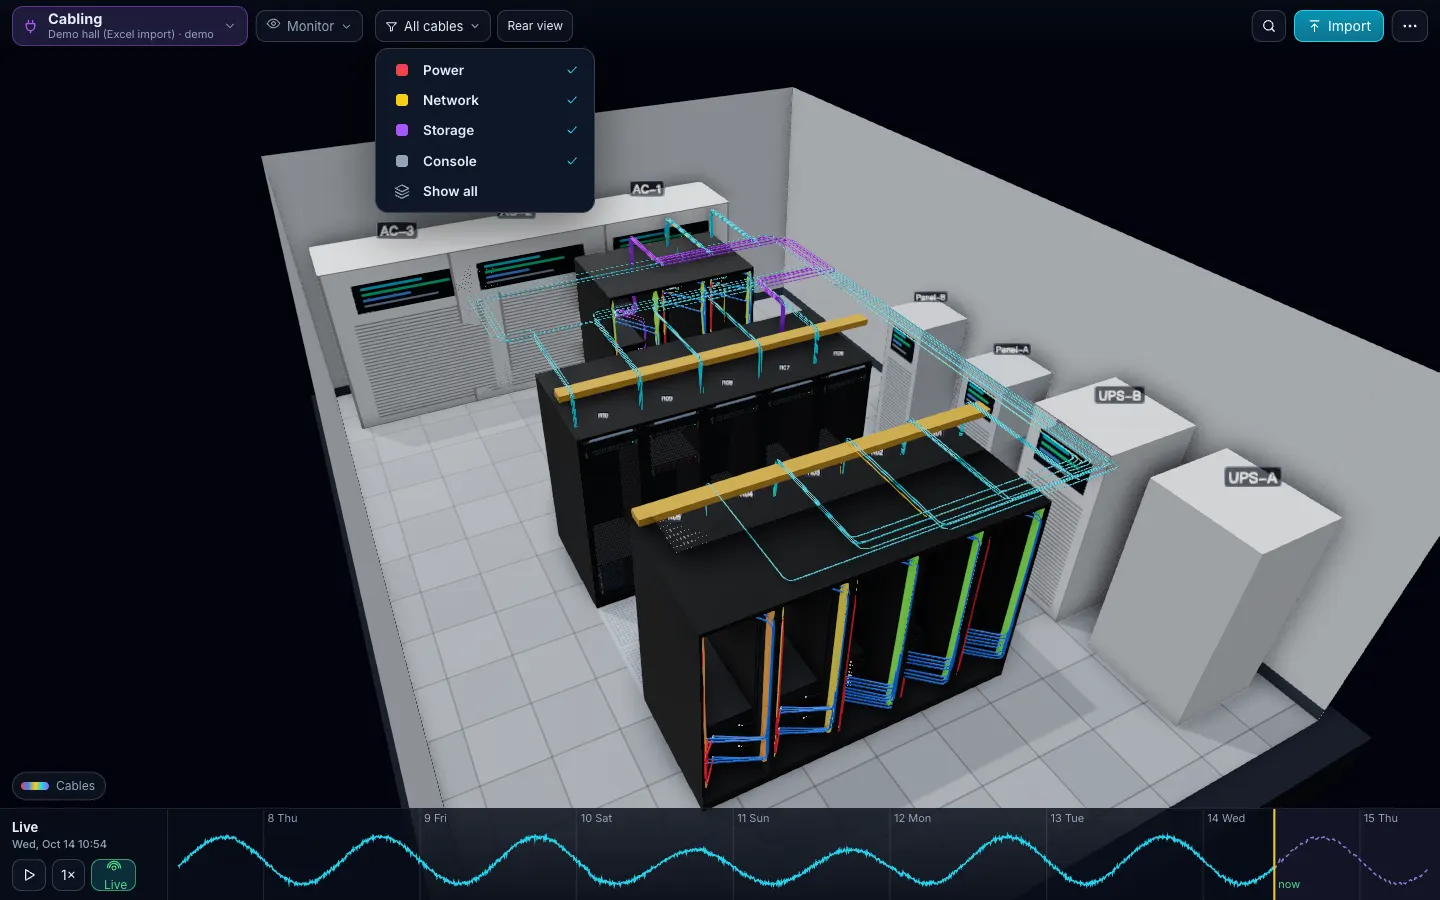
Cabling: “Where does this cable actually go?”
What you see: cables drawn as real runs, from the device port to the rear of the rack, through the vertical manager, along the overhead tray or under the floor (by route), to the other end. Bundles share a path. Colour by type: power A red and B blue, copper, fibre (OM and OS2), DAC, storage and console each in their own colour, with a filter per type. The rear of the rack is the default camera.
Trace: click a cable to see both ends, ports, media, speed, length, label and VLANs; Trace highlights the full path end to end through patch panels (a panel cable is two rows: device to panel port, panel port to switch).
Checks pinned in 3D: a device with no network or power cable; a port used twice; speed or media that does not match the port (10G on a 1G port, OM4 into OS2); both PSUs on the same feed; a cable shorter than the distance between its ends; missing labels; unknown device names in the Cables sheet.
From the sheet: Cables (from_device, from_port, to_device, to_port, type, phase, media, speed, length_m, color, label, vlan, route). Ports are free text and normalised (Gi1/0/1, eth0, SFP+1, port 5, PSU1, outlet 3).
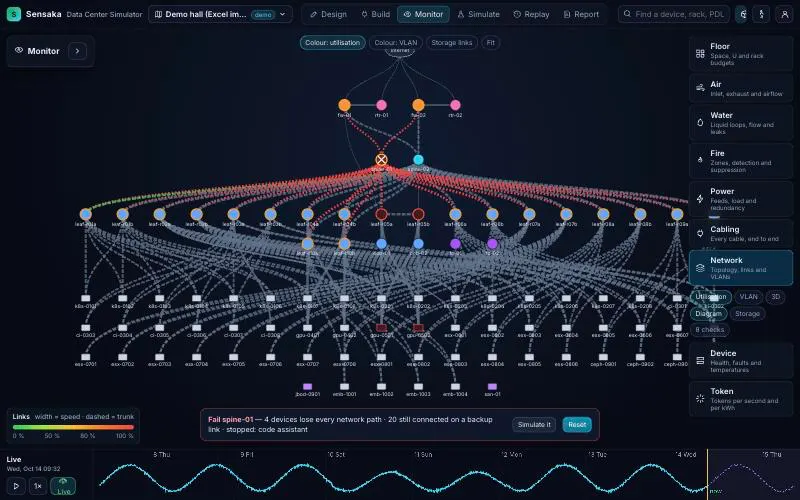
Network: “Fail this switch. Who still has a path?”
What you see (Diagram): a topology laid out from the network cables, patch panels collapsed: internet, router and firewall, core or spine, leaf or access, then servers and storage. Line width is speed; colour is utilisation (from link_mbps readings) or VLAN (from the Networks sheet); dashed lines are trunks. Storage links (SAS, FC) have their own filter.
What you see (3D): traffic particles along the network cables; port LEDs lit by utilisation.
What-if: fail a switch or a link and see which devices lose every path, which keep a backup uplink, which services stop and who loses storage. Power failures flow into the network layer automatically: a dark server disappears from the topology.
Checks: a single uplink on a device that runs something; a switch with one uplink; a link above 80 % utilisation; a VLAN used on a link but not defined; errors on a port.
From the sheet: Cables of type network or storage, Networks (vlan, name, purpose, subnet) and Readings items device:port with link_mbps and port_errors.
Why this matters for a 10-to-50-rack room
Most outages in small rooms are a single uplink, a patch panel nobody labelled, or two PSUs on the same feed. The check list finds those from the spreadsheet, before anyone walks to the rack.
Do I have to document every cable?
No. Start with the uplinks and power cords that matter and add the rest as you go. A device without a listed cable is flagged, never hidden.
What if the Cables sheet names a device that is not in Devices?
The row is reported as an unknown name and skipped; the import still succeeds.
Can it read switch port counters?
Through the Readings sheet today (item device:port, metrics link_mbps and port_errors), exported from your monitoring. Live port counters through connectors are on the roadmap.
Does it support patch panels and fibre trunks?
Yes. A panel is a device with ports, a cable through it is two rows, and the trace follows both.
Can I export the topology?
The incident log exports today; diagram export as PDF or SVG is on the roadmap.
Pricing that fits a 10-rack room
Design
from $490 per project, one-time
Plan a room or a new row; three months per project. The AI design assistant comes at no extra cost when it ships.
Monitor
$5 per rack per month, min $49
The twin of a running room, with what-if and reports.
Partner
30 % margin
For integrators, MSPs and consultants.
One Excel file. Your room in 3D.
Download the import template (v1.3, nine sheets, only Devices required) and the filled example from our demo hall. No form, no email needed, no macros in the files.
Fill in the Devices sheet and send it with your walkthrough request; we import it on the call. What each sheet does