

Both layers run on the demo rooms and on imported files. Live token and power counters from your systems need connectors, which are on the roadmap.
IT layers: Device · Token
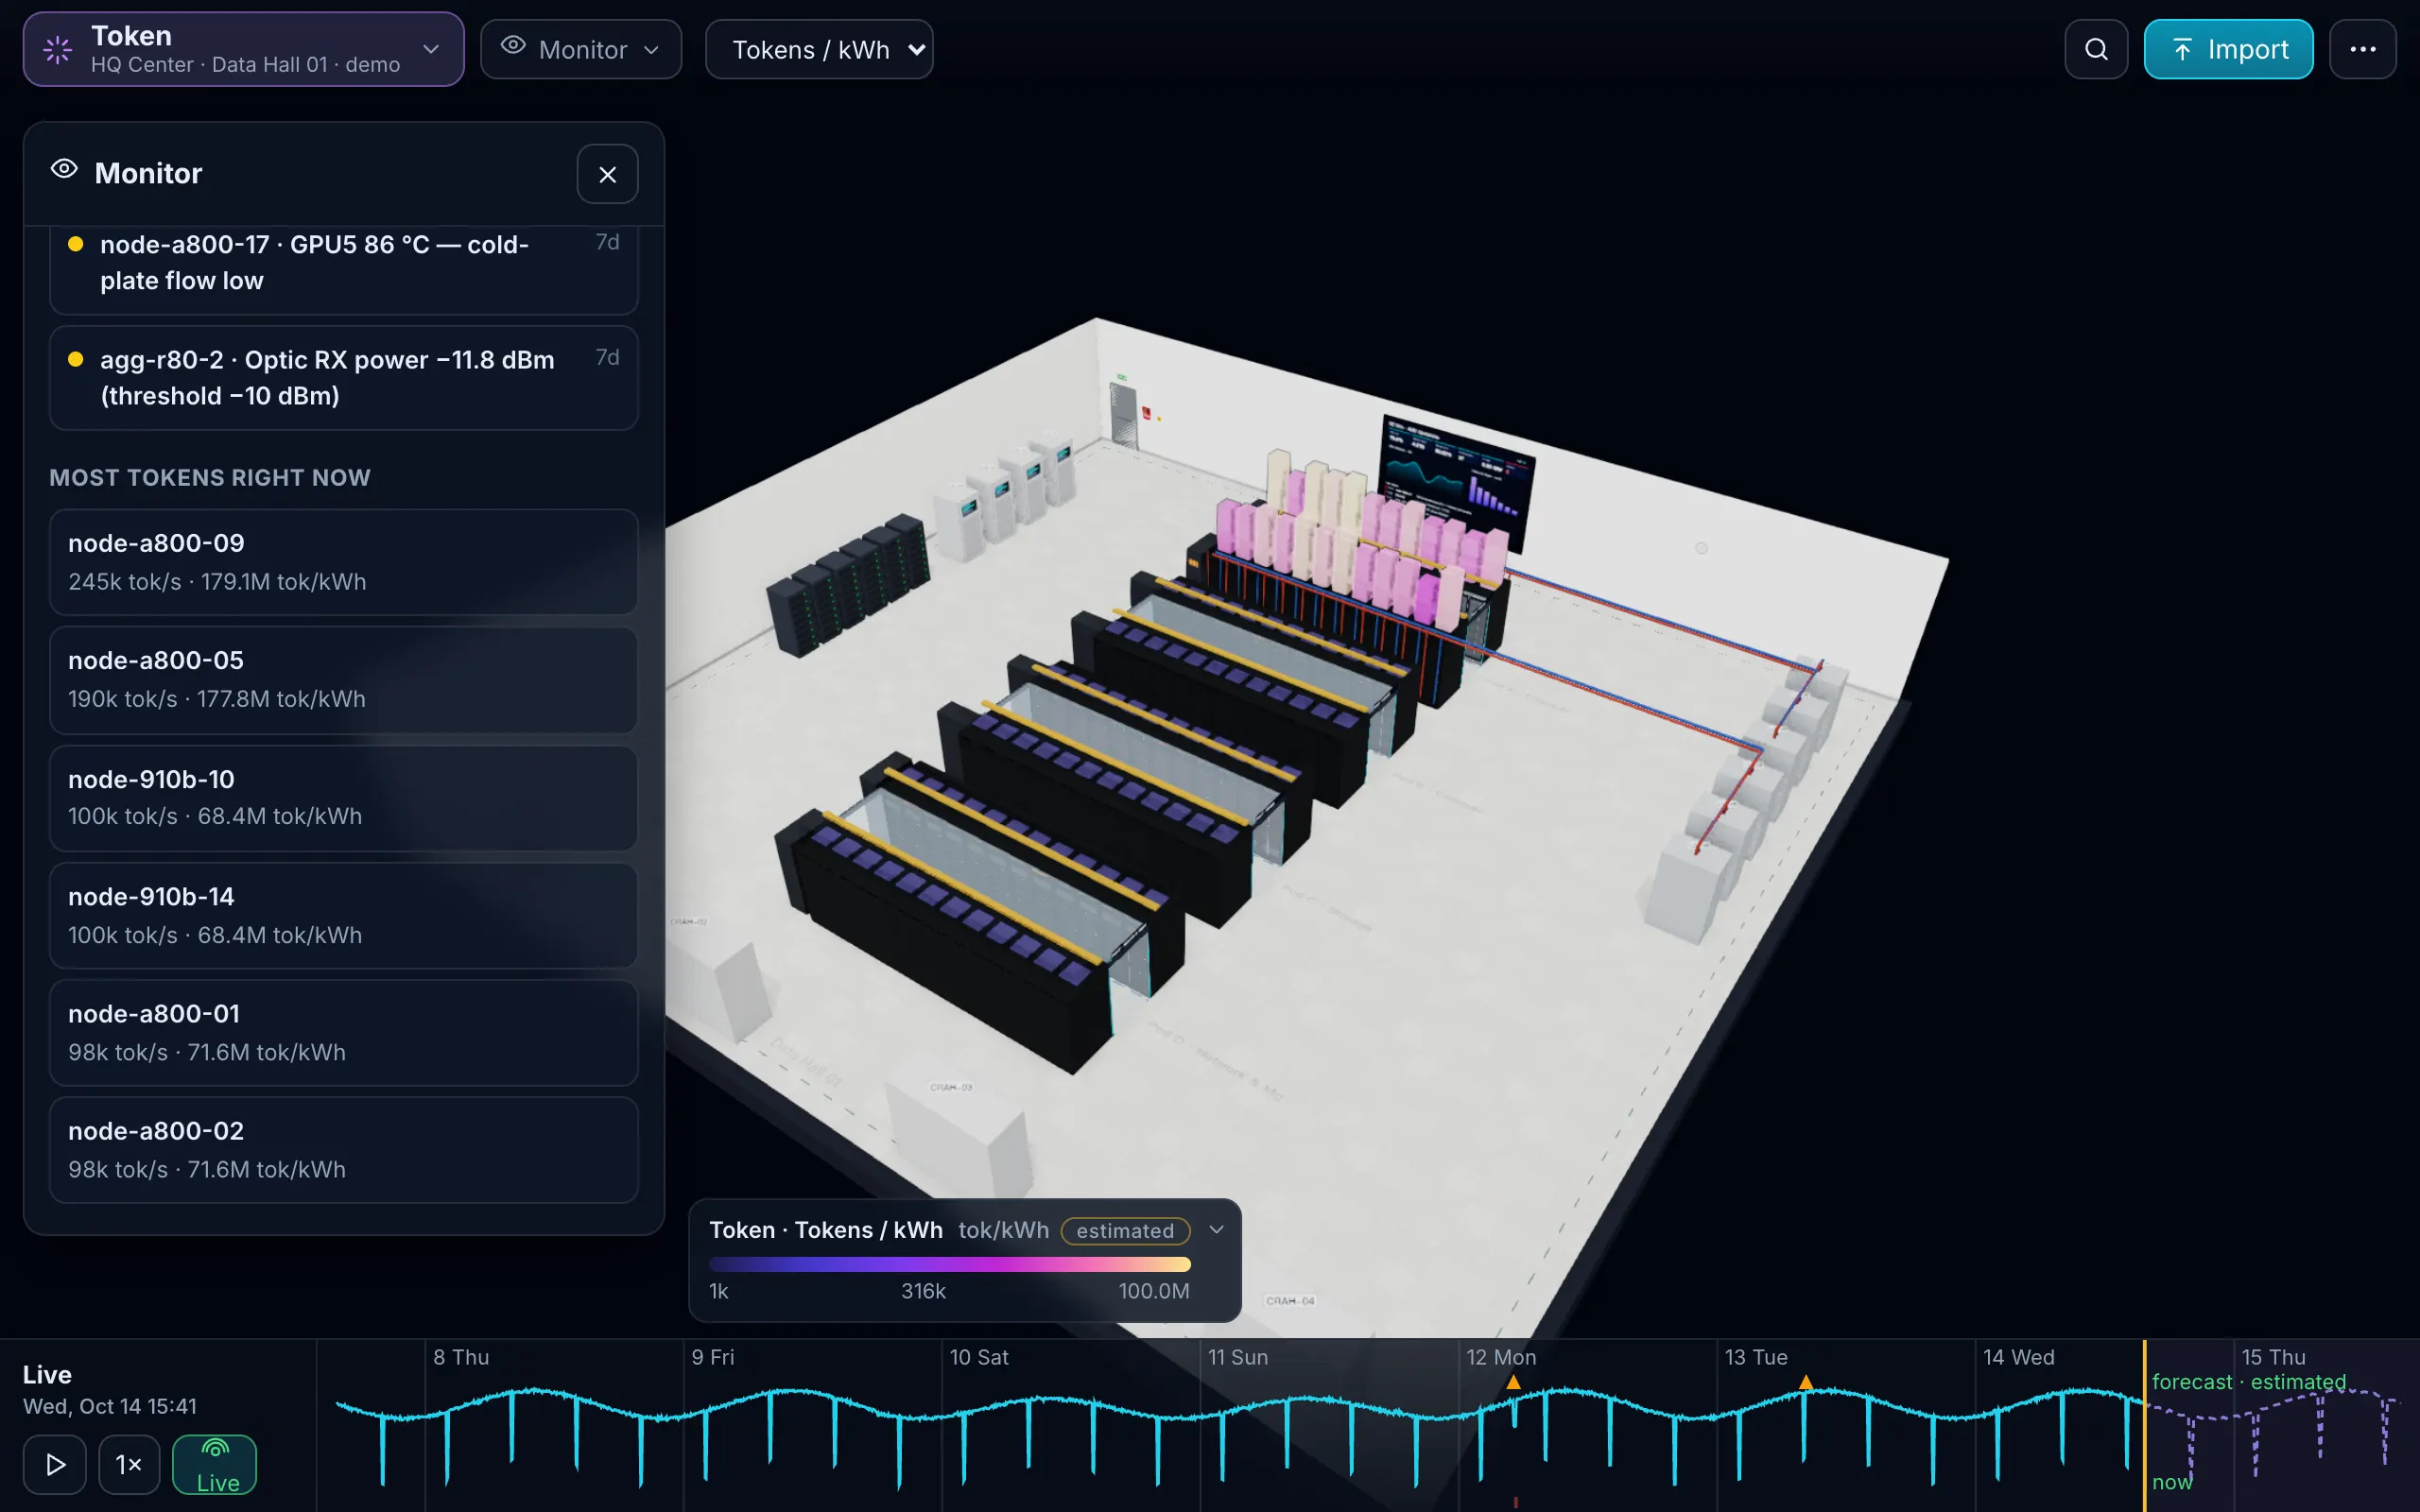
The IT layers are about the boxes and the work inside them. Device shows every server, switch, storage node and PDU with status, faults and parts; open it in its rack and take it apart. Token shows what the GPU nodes produce, tokens per second per server and tokens per kWh per rack, and how many tokens a failure would cost.
Device: “Open it. What’s inside, and who depends on it?”
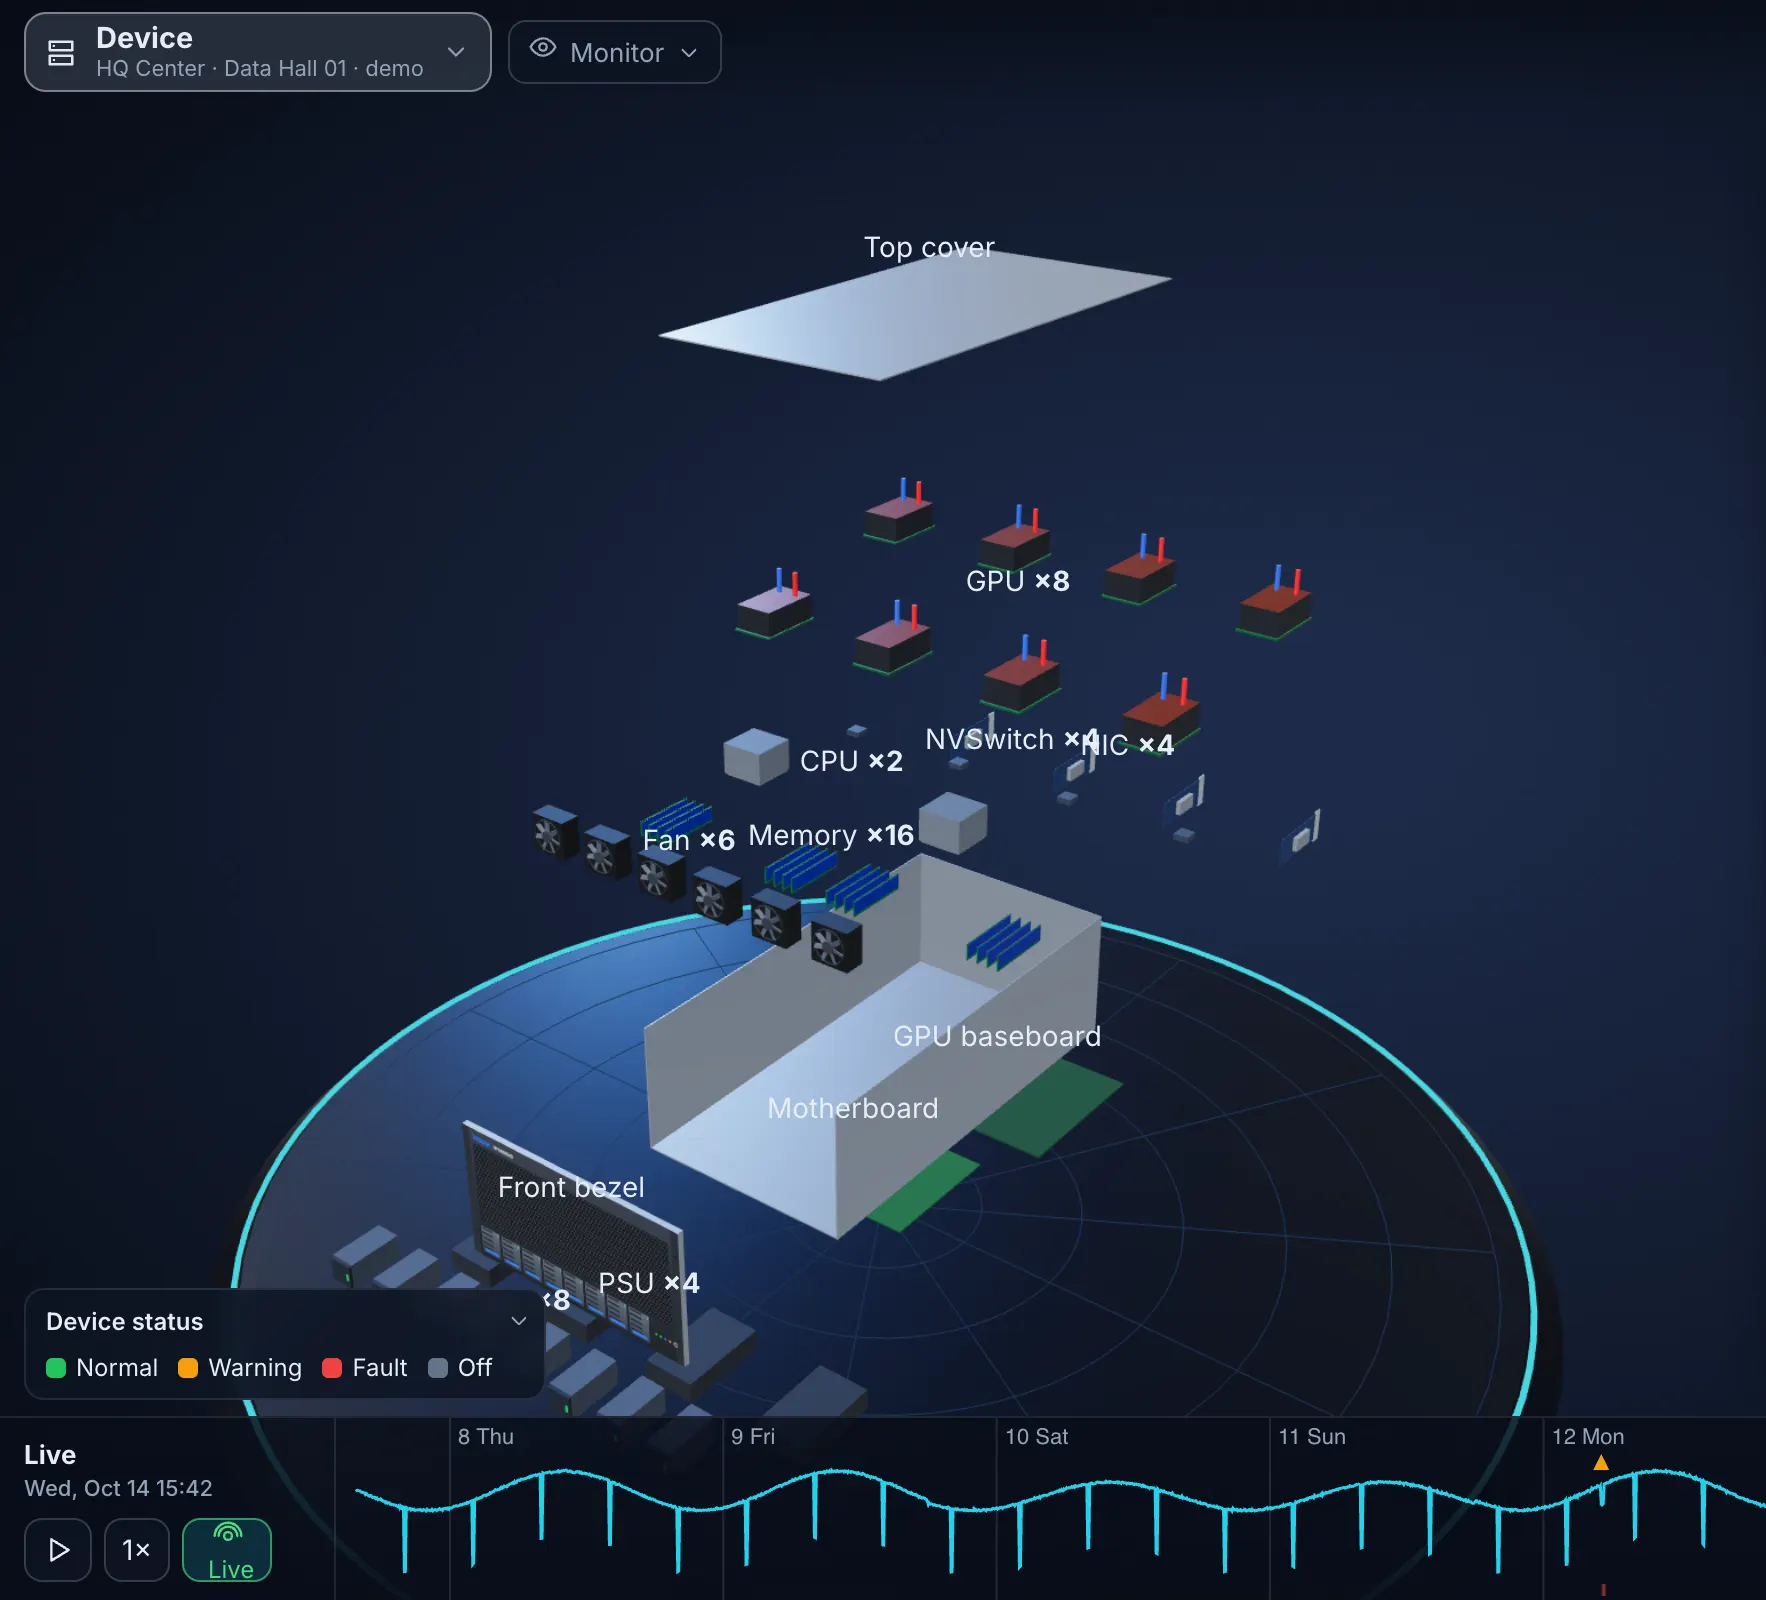
What you see: status, faults and LEDs on every device. Walk to a rack, open a server, dissect it to its parts (PSUs, fans, DIMMs, drives, GPUs), with per-component values where a source provides them.
What-if: a fault on a part lists the device, its workloads (the runs column) and its tenants. Warranty ending within 12 months is flagged at import.
From the sheet: Devices (rack, u, model, name, role, height_u, power_cords, serial, owner, warranty_end, runs). The model text is matched to the device catalog (exact, aliases, model codes, then fuzzy: “PE R740XD” finds the right server). Unknown models become plain boxes to identify later.
The catalog: servers, GPU nodes, switches, storage, PDUs, UPSes, cooling units and CDUs with size, weight, power, airflow, cooling and a part tree, built from public spec sheets and manuals and seeded by an open device-type library. Performance fields (cores and TDP, GPU throughput, storage IOPS, network bandwidth) are being added so Design mode can size with them.
Token: “Which server produced the most tokens, and at what energy cost?”
What you see: tokens-per-second columns on GPU nodes, tokens per kWh as colour across the room, top producers in Monitor, tokens by workload, tenant, model and server in Report.
The metric: tokens per kWh = tokens produced ÷ energy used by the server (or the rack, with its share of the facility). It is the one number that ties an AI room’s output to its power bill, per server, per rack, per tenant. Where the energy side is a model estimate rather than a metered value, it is labelled estimated.
What-if: every scenario reports tokens lost. Fail a feed, stop a cooling unit, open a leak, and the Token layer shows the serving capacity that disappears.
Data today: the demo rooms carry token counters, and you can import token and power history through the Readings sheet. Live data from serving-stack metrics and GPU telemetry comes through the agent’s collectors, which are built but not yet tested against live systems (roadmap).
Tokens per kWh is still a spreadsheet metric in most AI rooms: watts from one dashboard, tokens from another. Put both on the rack and the comparison between two servers, two racks or two tenants becomes a colour. Try the tokens per kWh calculator or read tokens per kWh, the one metric for an AI room.
Chargeback and capacity
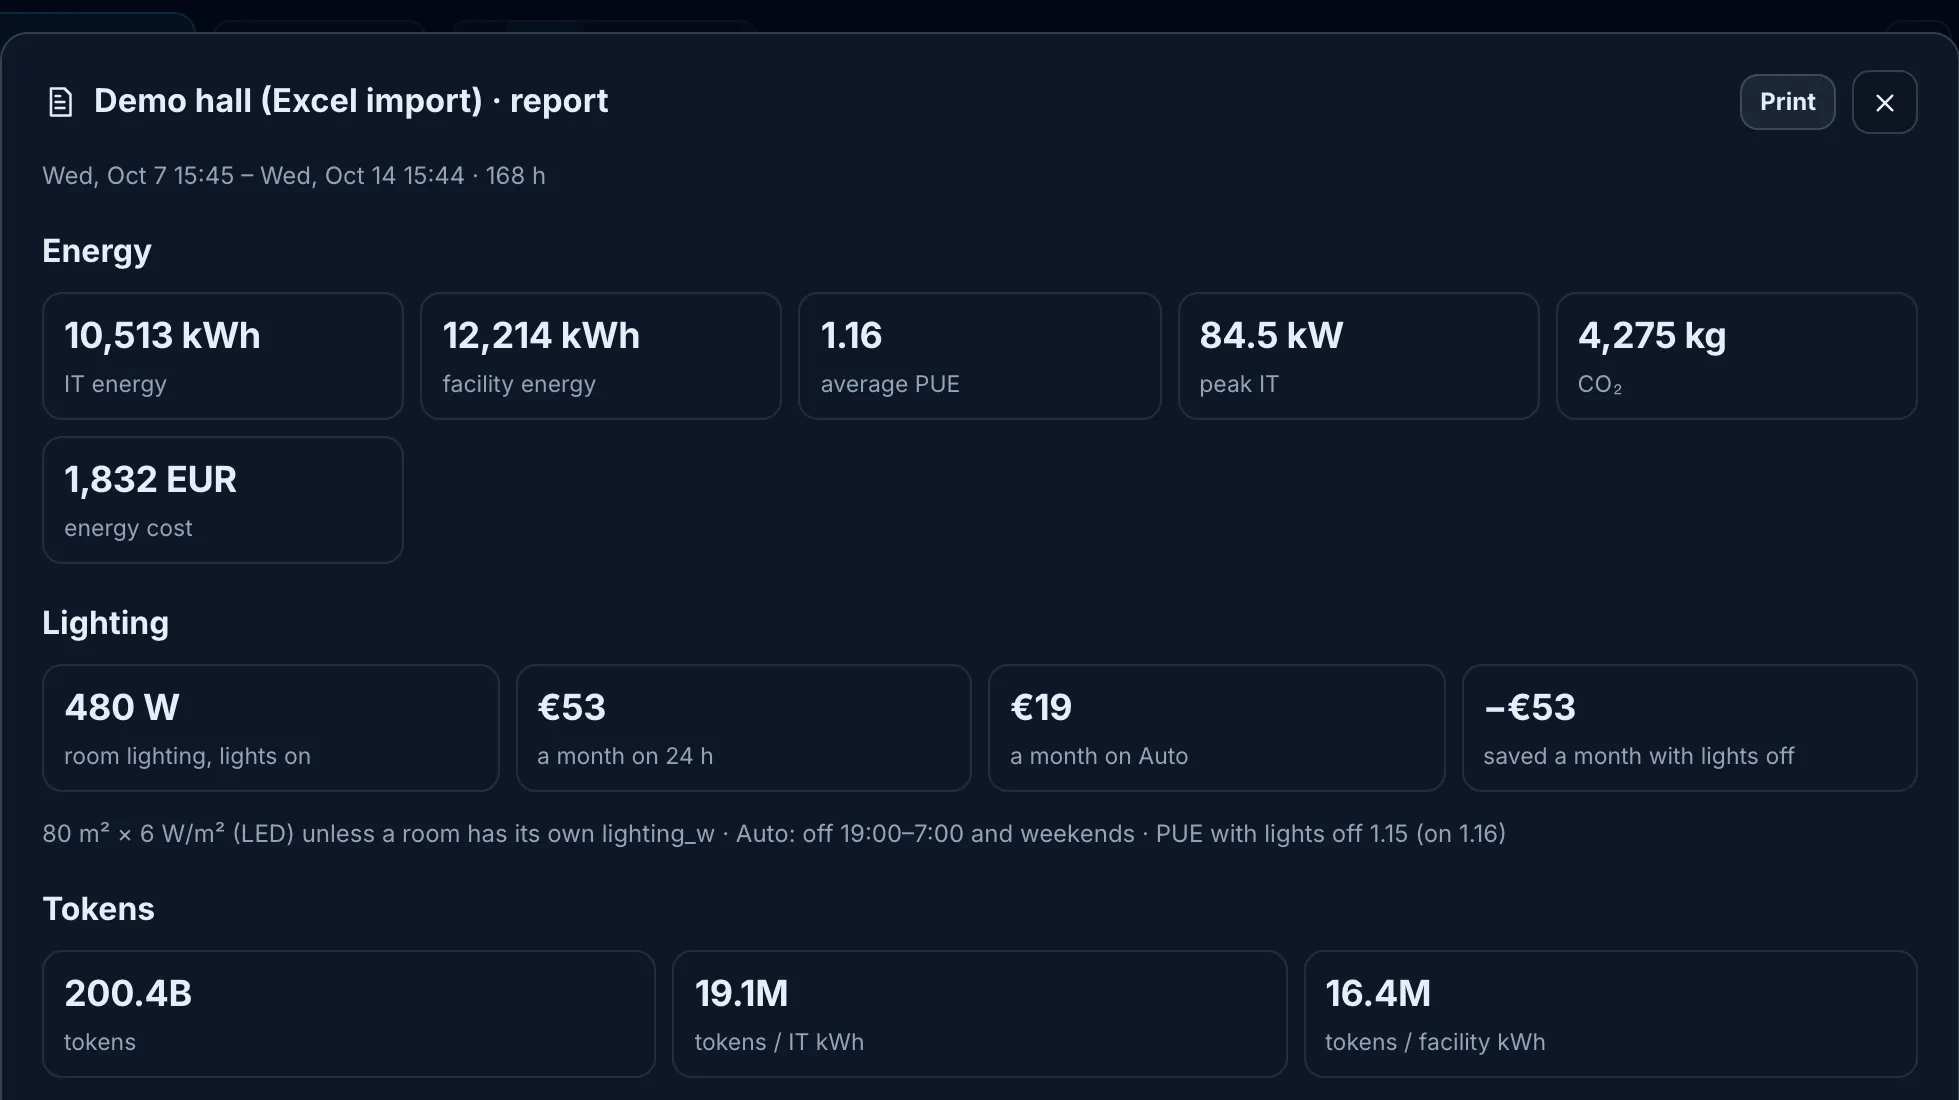
Report mode gives tokens by workload, tenant, model and server, energy and cost at your tariff, and tokens per kWh side by side, so chargeback is a report rather than a spreadsheet. Estimated values are tagged.
What do I need for tokens per kWh?
A token counter from your serving stack and a power reading for the same server. Today both can come in as history through the Readings sheet; live collection through connectors is on the roadmap.
Does it work for training as well as inference?
Token counters come from serving stacks. Training jobs show GPU utilisation and power; tokens per kWh for training needs a job-level counter, which is on the roadmap.
Can it tell me which GPUs are idle?
Monitor shows per-node utilisation and tokens per second; a ranked idle-GPU report is on the roadmap.
Is the device catalog complete?
No catalog is. Known models are filled in; unknown ones are plain boxes with the height you gave, flagged "identify later". Send us a spec sheet and it is added.
Can I see component-level telemetry?
Where a source provides it, on the part inside the dissected device: from imported readings today, from connectors when they ship.
Pricing that fits a 10-rack room
Design
from $490 per project, one-time
Plan a room or a new row; three months per project. The AI design assistant comes at no extra cost when it ships.
Monitor
$5 per rack per month, min $49
The twin of a running room, with what-if and reports.
Partner
30 % margin
For integrators, MSPs and consultants.
One Excel file. Your room in 3D.
Download the import template (v1.3, nine sheets, only Devices required) and the filled example from our demo hall. No form, no email needed, no macros in the files.
Fill in the Devices sheet and send it with your walkthrough request; we import it on the call. What each sheet does