

Runs on the demo rooms and on any file you import.
Fail anything. See what goes dark.
A data center what-if simulation answers one question before reality does: if this fails, what else fails? DC Sim generates a scenario library from your own model (utility loss, generator failure, feed A lost at peak, UPS, cooling or CDU failure, a leak, a fire, 25 % more load), runs each next to an untouched baseline, and lists the racks, devices, services and tokens affected on a timeline.
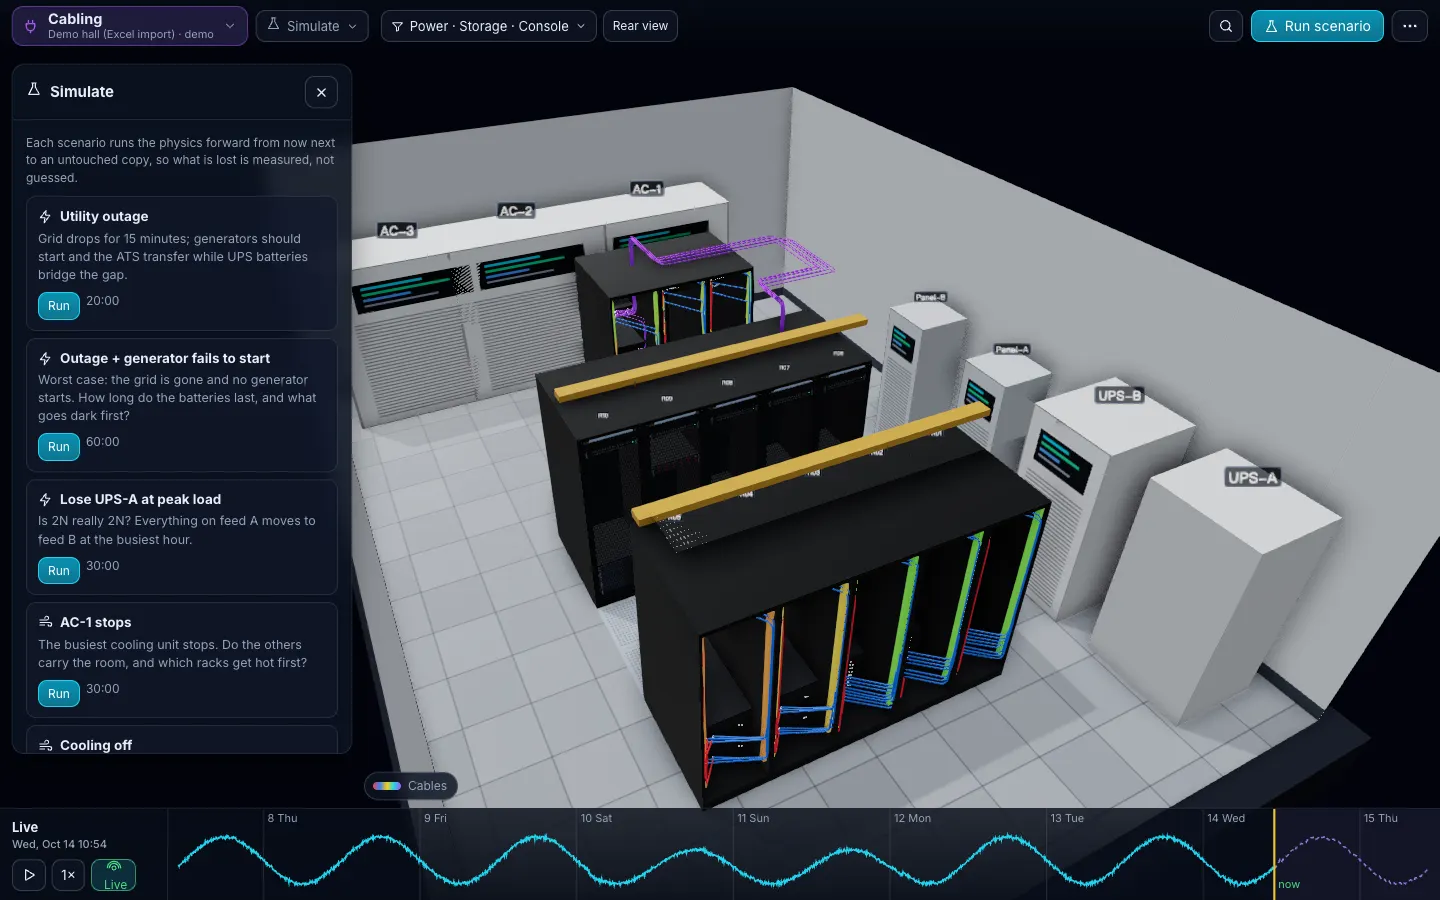
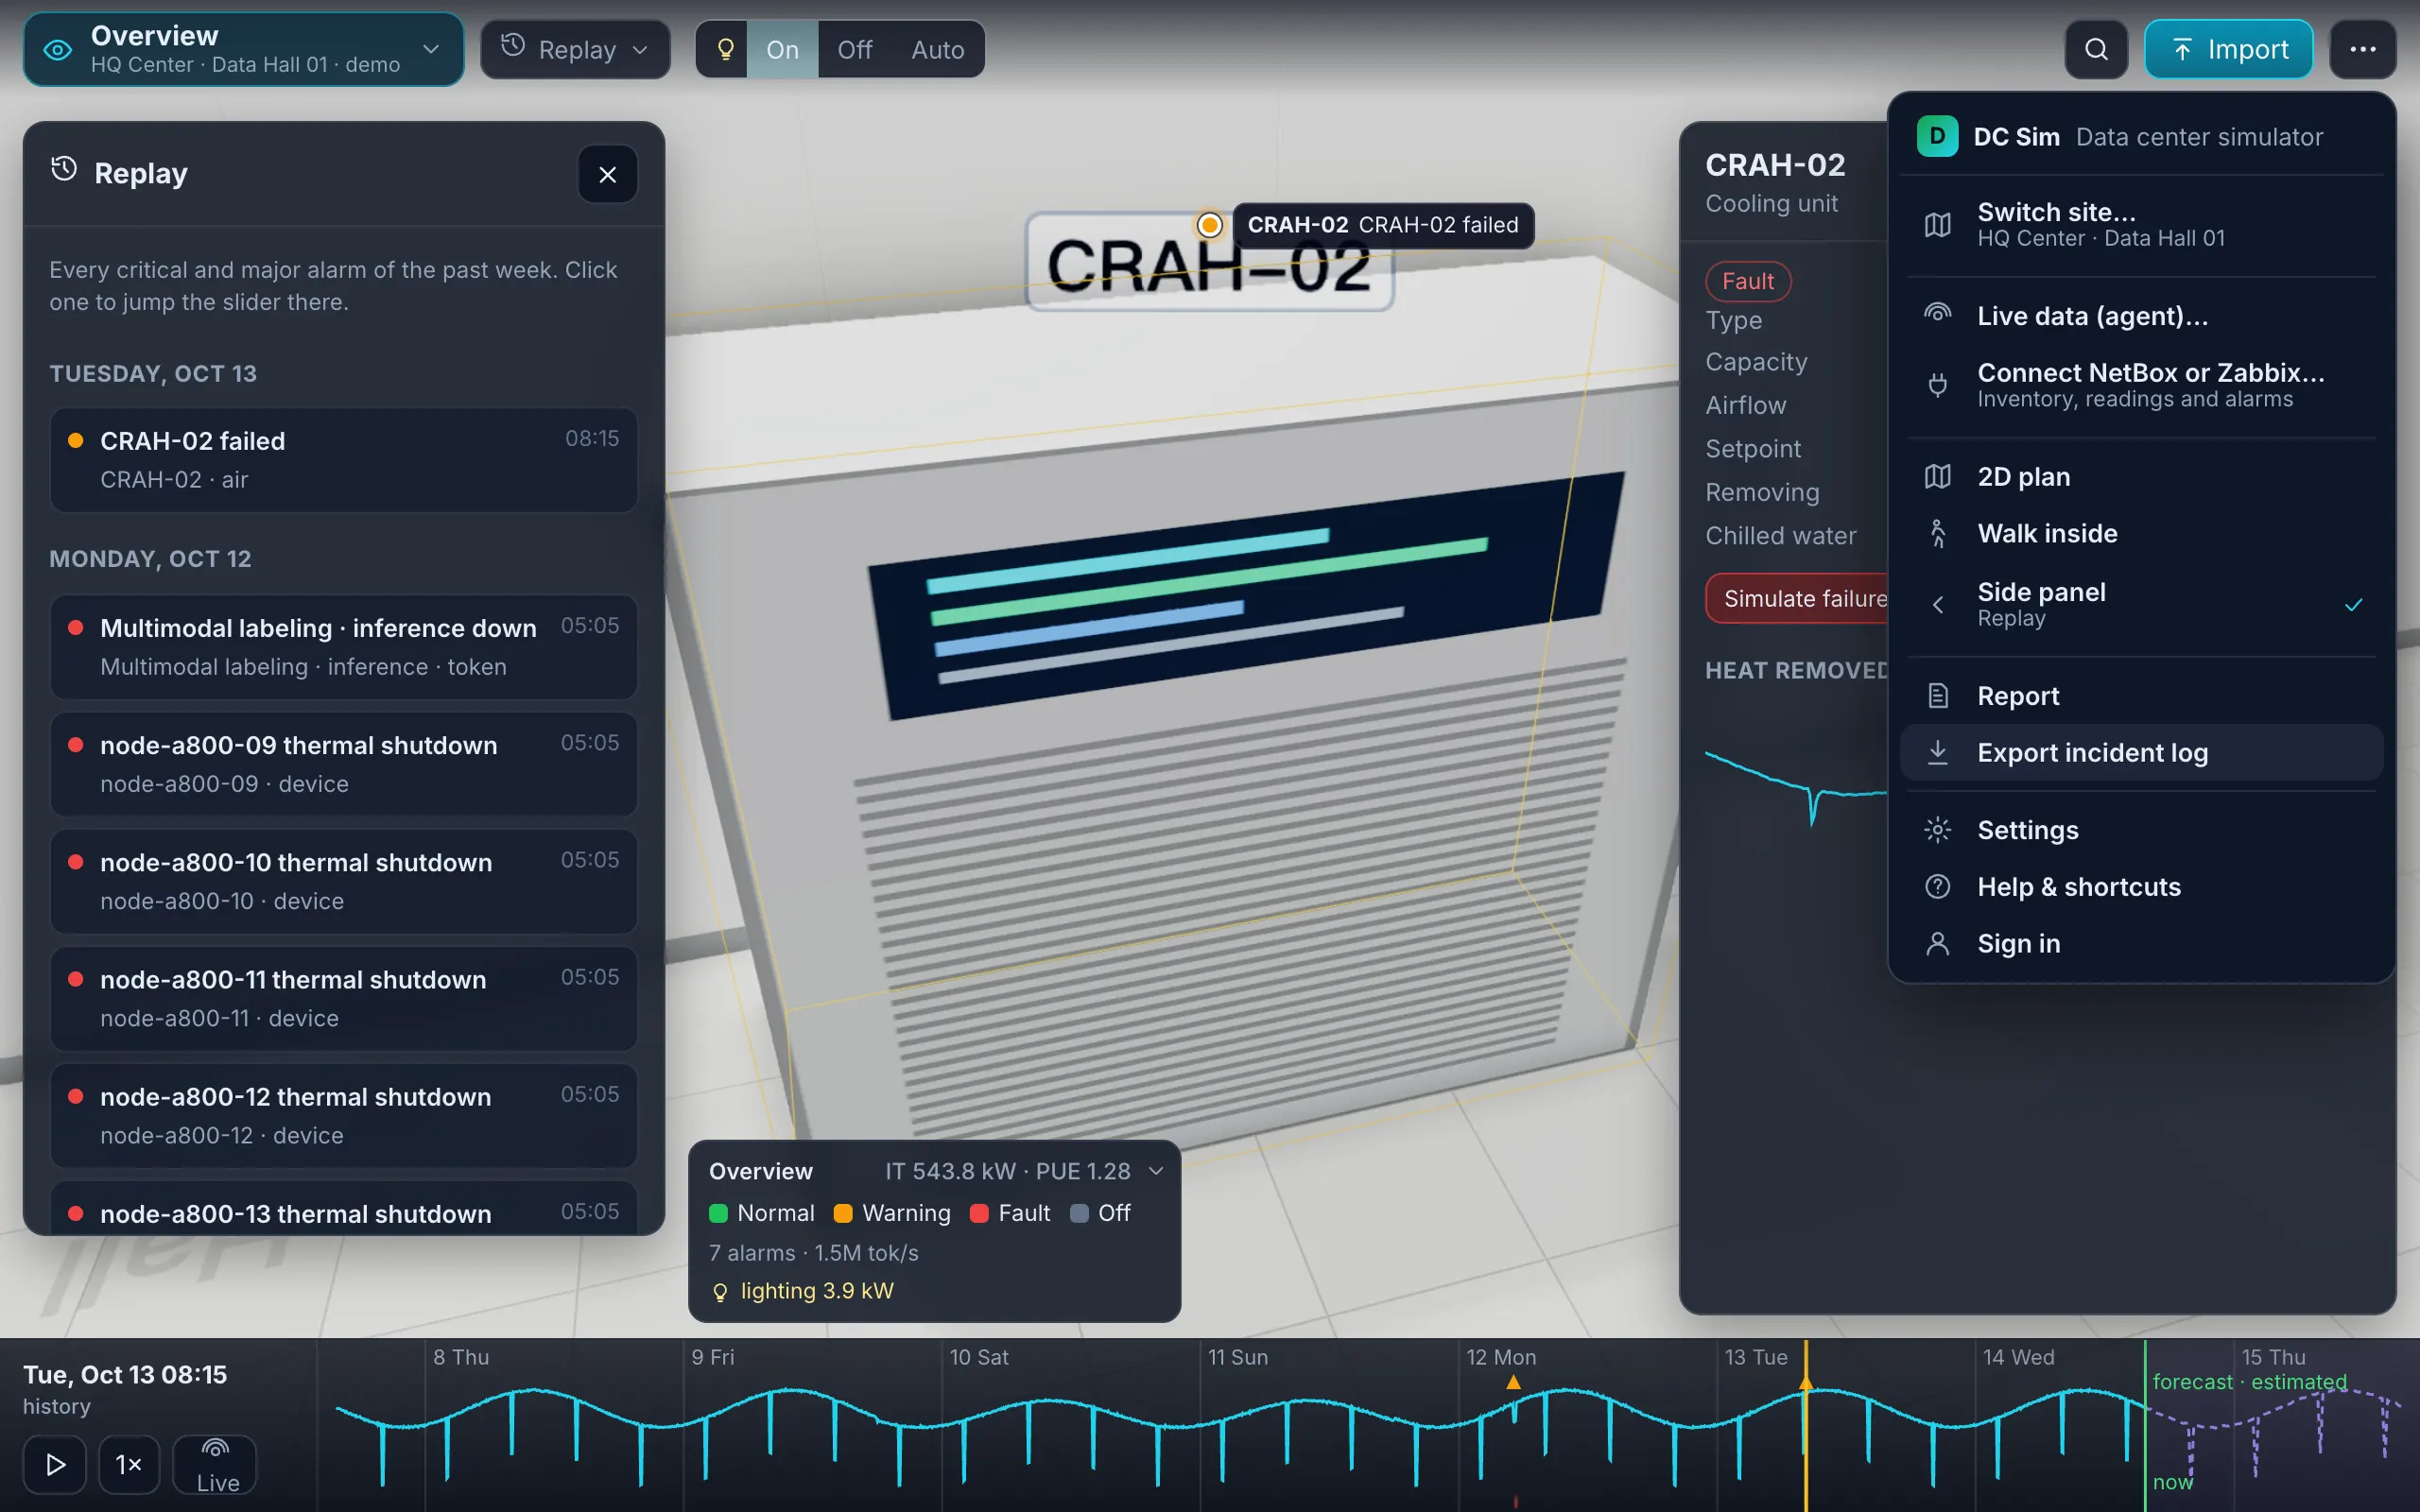
Two speeds of what-if
Fail (instant). Click any node in the power one-line, the network topology or the 3D room and press Fail. A graph propagation runs on the server: power failures darken devices, the network graph loses them, and the diagram, the 3D view (rack tint, device colours, dead cables) and a banner show the result at once, for example “Fail UPS-A — 2 devices lose power · 90 run on one feed · overloaded: PDU-R05-B 113.9%”.
Simulate it (timeline). The same failure through the full simulator (battery runtime, generator start, breaker curves, thermal transients, tokens lost), minute by minute, next to the baseline. Estimated values are labelled.
The scenario library
| Scenario | What it answers | Layers |
|---|---|---|
| Utility loss | does the generator start in time; runtime on batteries at current load | Power |
| Generator fails to start | which racks are on borrowed time, and for how long (estimated) | Power |
| Lose feed A at peak | who goes dark, who survives on B, which PDU overloads | Power, Network, Token |
| UPS module failure | orphaned single-corded devices, services lost | Power |
| Cooling unit or chiller failure | minutes to 27, 32 and 35 °C per rack (estimated) | Air |
| CDU failure or manifold leak | litres released (estimated), isolation valve, racks isolated | Water |
| Fire in a zone | detection, alarm, HVAC interlock, release, EPO; racks and services in the zone | Fire, Power |
| 25 % more load | which breakers, coolers and racks cross 80 %; capacity runway | Power, Air, Floor |
| Custom | fail any node, cut any cable, stop any cooler | all |
Every run reports tokens lost when GPU nodes are involved.
Replay and Report
Replay: the week’s critical and major alarms on the time slider. Scrub to the minute, see the room as it was, export the incident log.
Report: energy, PUE, CO₂ and cost; tokens by workload, tenant, model and server; tokens per kWh; capacity runway; thermal; incidents; warranty expiries. Estimates are tagged.
Drills that cost nothing
Run the feed-A drill before the maintenance window, not during it. Show the audit to the customer before the contract. Put the incident replay in the post-mortem instead of a whiteboard sketch.
UPS failure impact analysis used to mean a consultant and a week. Here it is: fail the UPS, read the orphan list, fix the single-corded devices, run it again. Step by step: UPS failure impact analysis in 20 minutes.
How accurate is the simulation?
Power and network what-if are exact for the chain you describe: if the sheet says a device has one cord on feed A, it goes dark when A fails. Thermal, liquid and runtime projections are zonal-model estimates and are labelled "estimated". Nothing here is CFD.
Can I run scenarios on a design that is not built yet?
Yes. Design and Simulate use the same model; the N−1 audit is a batch of these scenarios.
Does a scenario change my twin?
No. Every scenario runs next to an untouched baseline; nothing is written to the model of your room.
Can I schedule drills or share results?
Export the incident log today; scheduled drills and shared links are on the roadmap.
What does "tokens lost" mean?
The tokens per second the affected GPU nodes were producing, summed over the scenario's duration: the serving capacity a failure would cost, at the measured or estimated rate.
Pricing that fits a 10-rack room
Design
from $490 per project, one-time
Plan a room or a new row; three months per project. The AI design assistant comes at no extra cost when it ships.
Monitor
$5 per rack per month, min $49
The twin of a running room, with what-if and reports.
Partner
30 % margin
For integrators, MSPs and consultants.
One Excel file. Your room in 3D.
Download the import template (v1.3, nine sheets, only Devices required) and the filled example from our demo hall. No form, no email needed, no macros in the files.
Fill in the Devices sheet and send it with your walkthrough request; we import it on the call. What each sheet does