

All five layers run on the demo rooms and on any file you import.
Facility layers: Floor · Air · Water · Fire · Power
The facility layers show the room itself: where racks stand and how full they are, how air and coolant move, which fire zone covers which rack, and how power reaches every PSU. Each layer is built from your Excel sheets (Racks, Cooling, Power, Devices) and each one answers a "what if this stops" question with an estimated, labelled answer.
Floor: “Will it fit?”
What you see: rooms, tile grid, hot and cold aisles, racks with U used, kW against budget and weight per rack. Aisles alternate by row unless your Racks sheet says otherwise (front_faces A or B).
Checks pinned in 3D: U overlaps, overweight racks, kW over the rack budget, unknown models shown as plain boxes to identify later.
From the sheet: Racks (rack, row, position, height_u, width_in, front_faces, max_kw) and Devices (rack, u, model, height_u).
A hot aisle / cold aisle layout tool should take rows and racks and give you aisles, not a drawing exercise. Fill the Racks sheet with row and position; the room, the aisles and the rack budgets appear. Change front_faces and the aisle flips.
Air: “A cooling unit stops. How many minutes?”
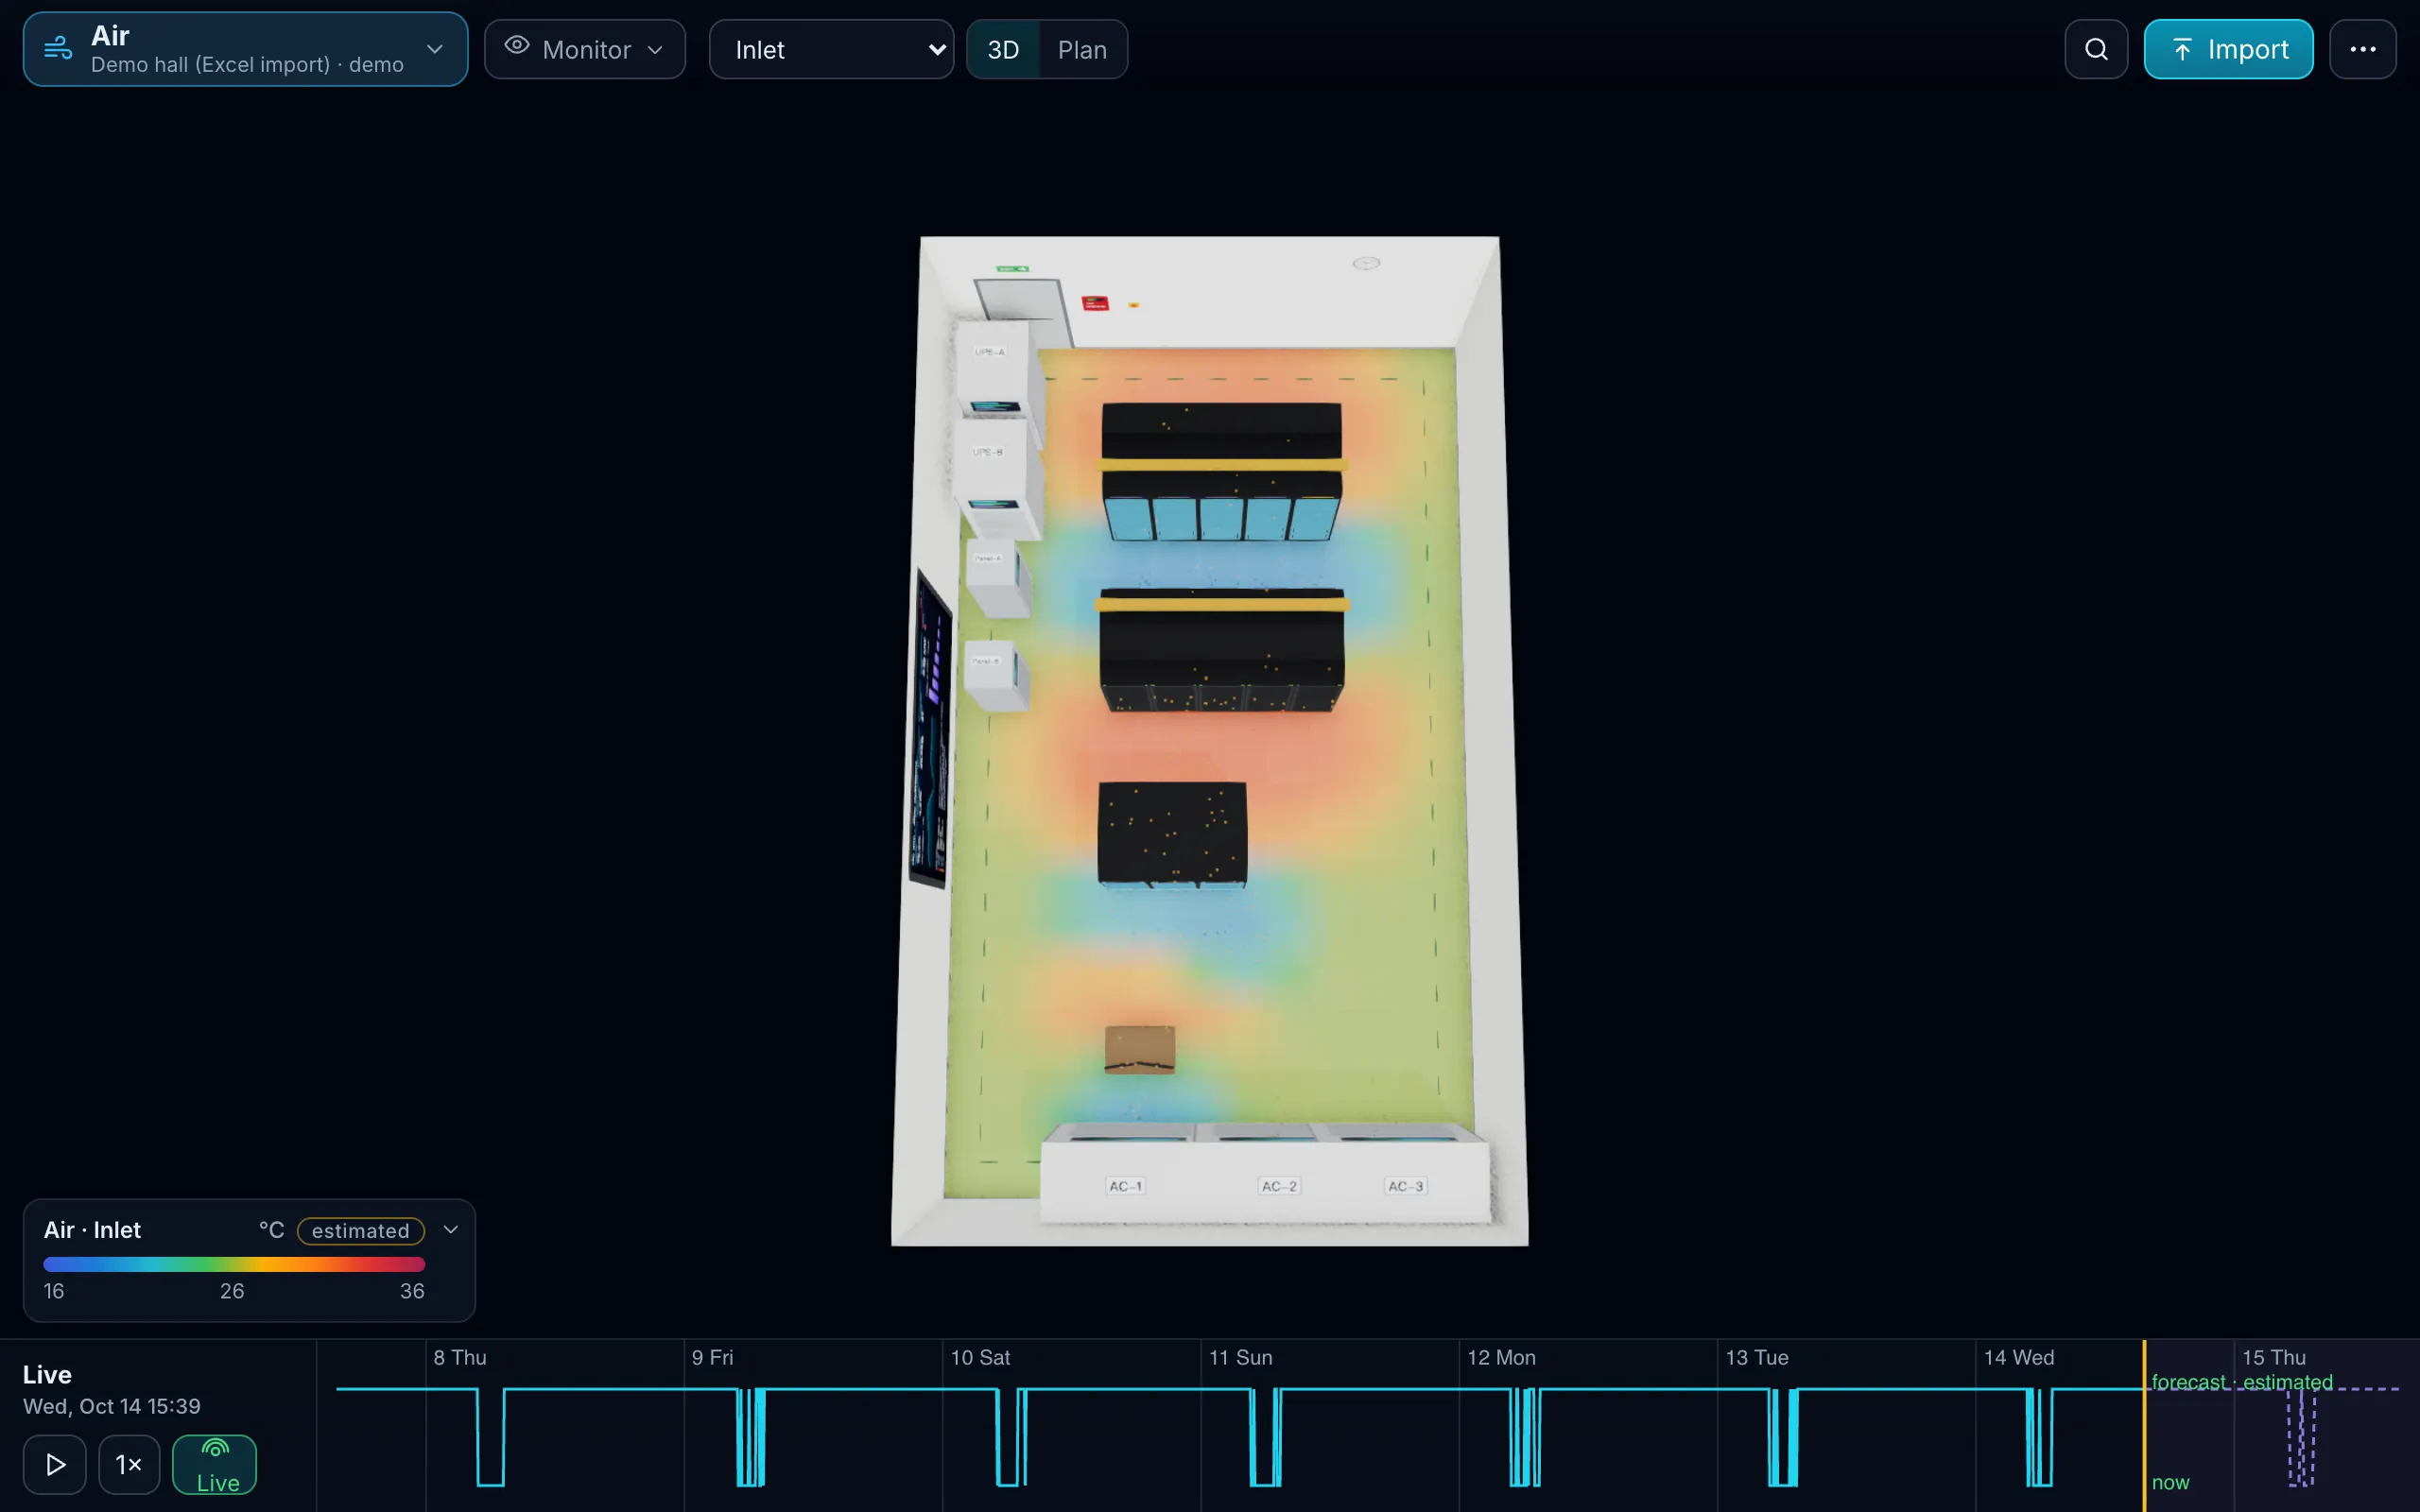
What you see: rack inlet and exhaust temperature, a floor heat map, airflow particles; the hottest inlet as a KPI in Monitor.
What-if: fail a CRAH, chiller or AC unit and inlet temperatures climb; minutes to 27, 32 and 35 °C per rack, estimated by a zonal model and labelled as such. Not CFD.
From the sheet: Cooling (name, type, capacity_kw, serves, model), plus temperature history in the Readings sheet if you have it. Heat above cooling capacity is flagged at import.
Water: “Which racks does this leak take out?”
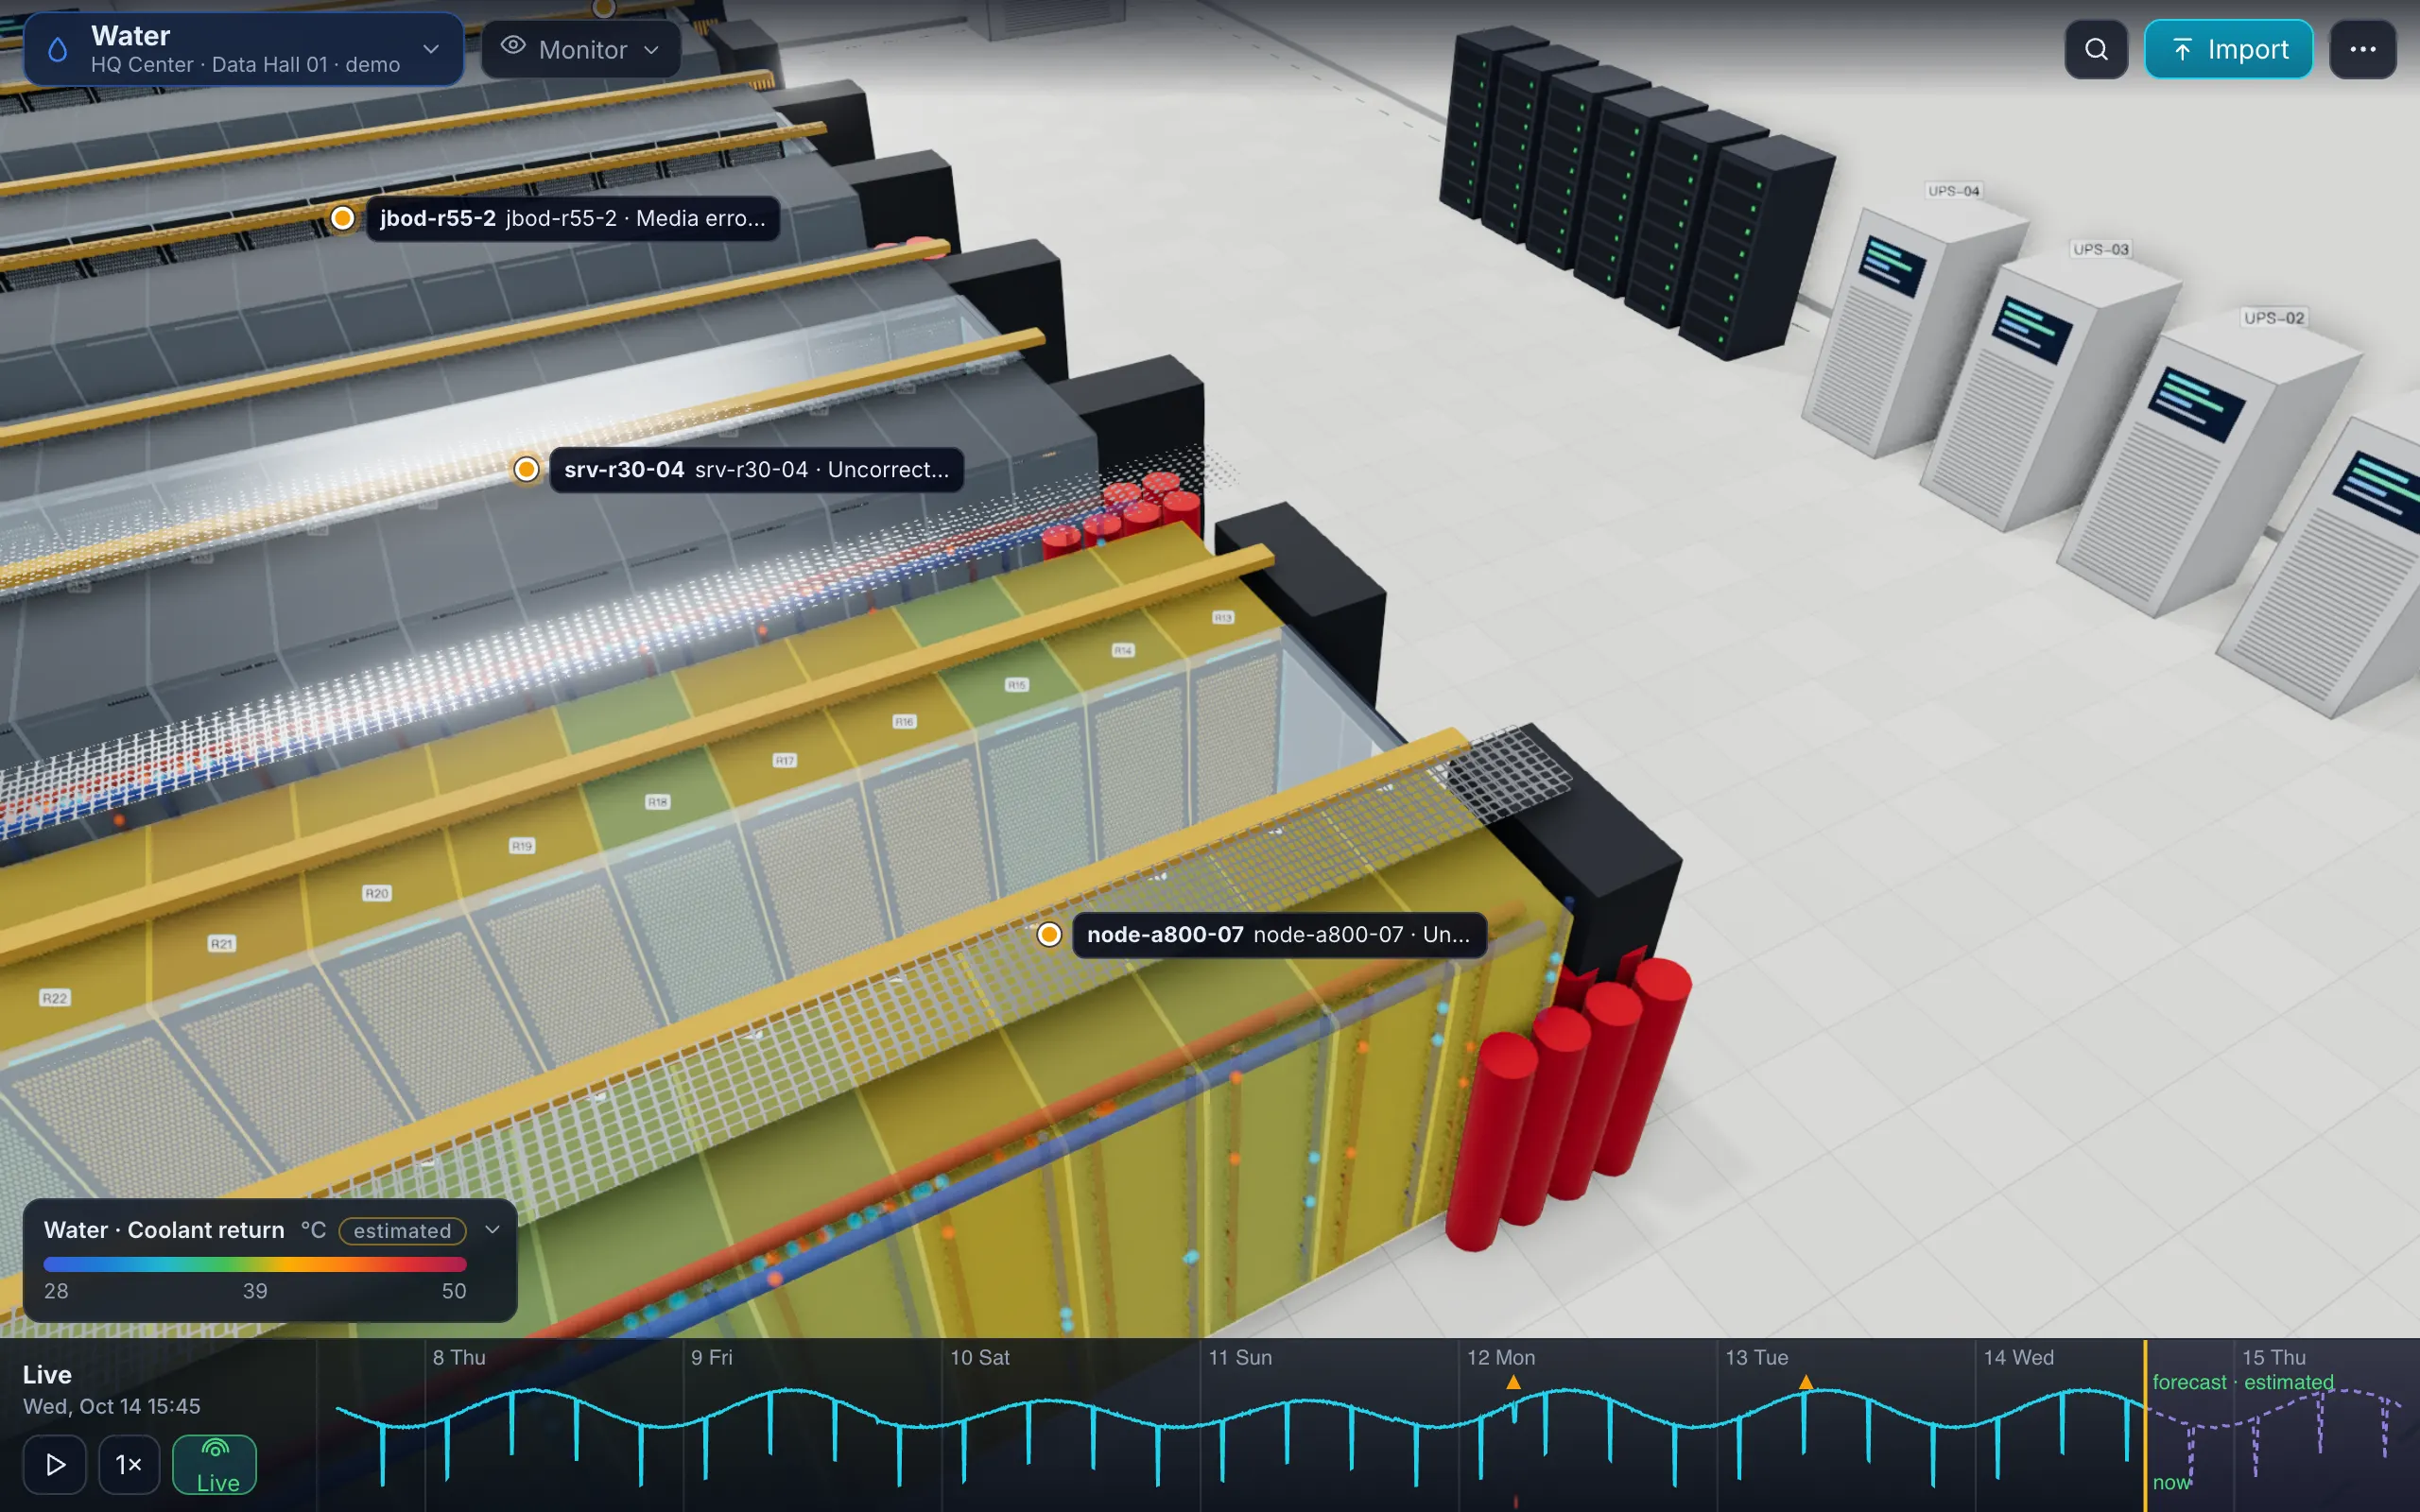
What you see: chilled-water loops, CDUs, manifolds, coolant return temperature, flow particles.
What-if: a CDU stops; a manifold leaks: litres released (estimated), the isolation valve closes, racks are taken offline. Built for small rooms adding a liquid-cooled GPU row next to air-cooled racks: both live in one model.
From the sheet: Cooling rows of liquid types (CDU, loop) with serves listing the racks.
Liquid cooling planning for a small data center starts with one question: which racks go on the loop, and what happens to them when the CDU stops. Model it before the pipes are ordered.
Fire: “What is the sequence, and who is affected?”
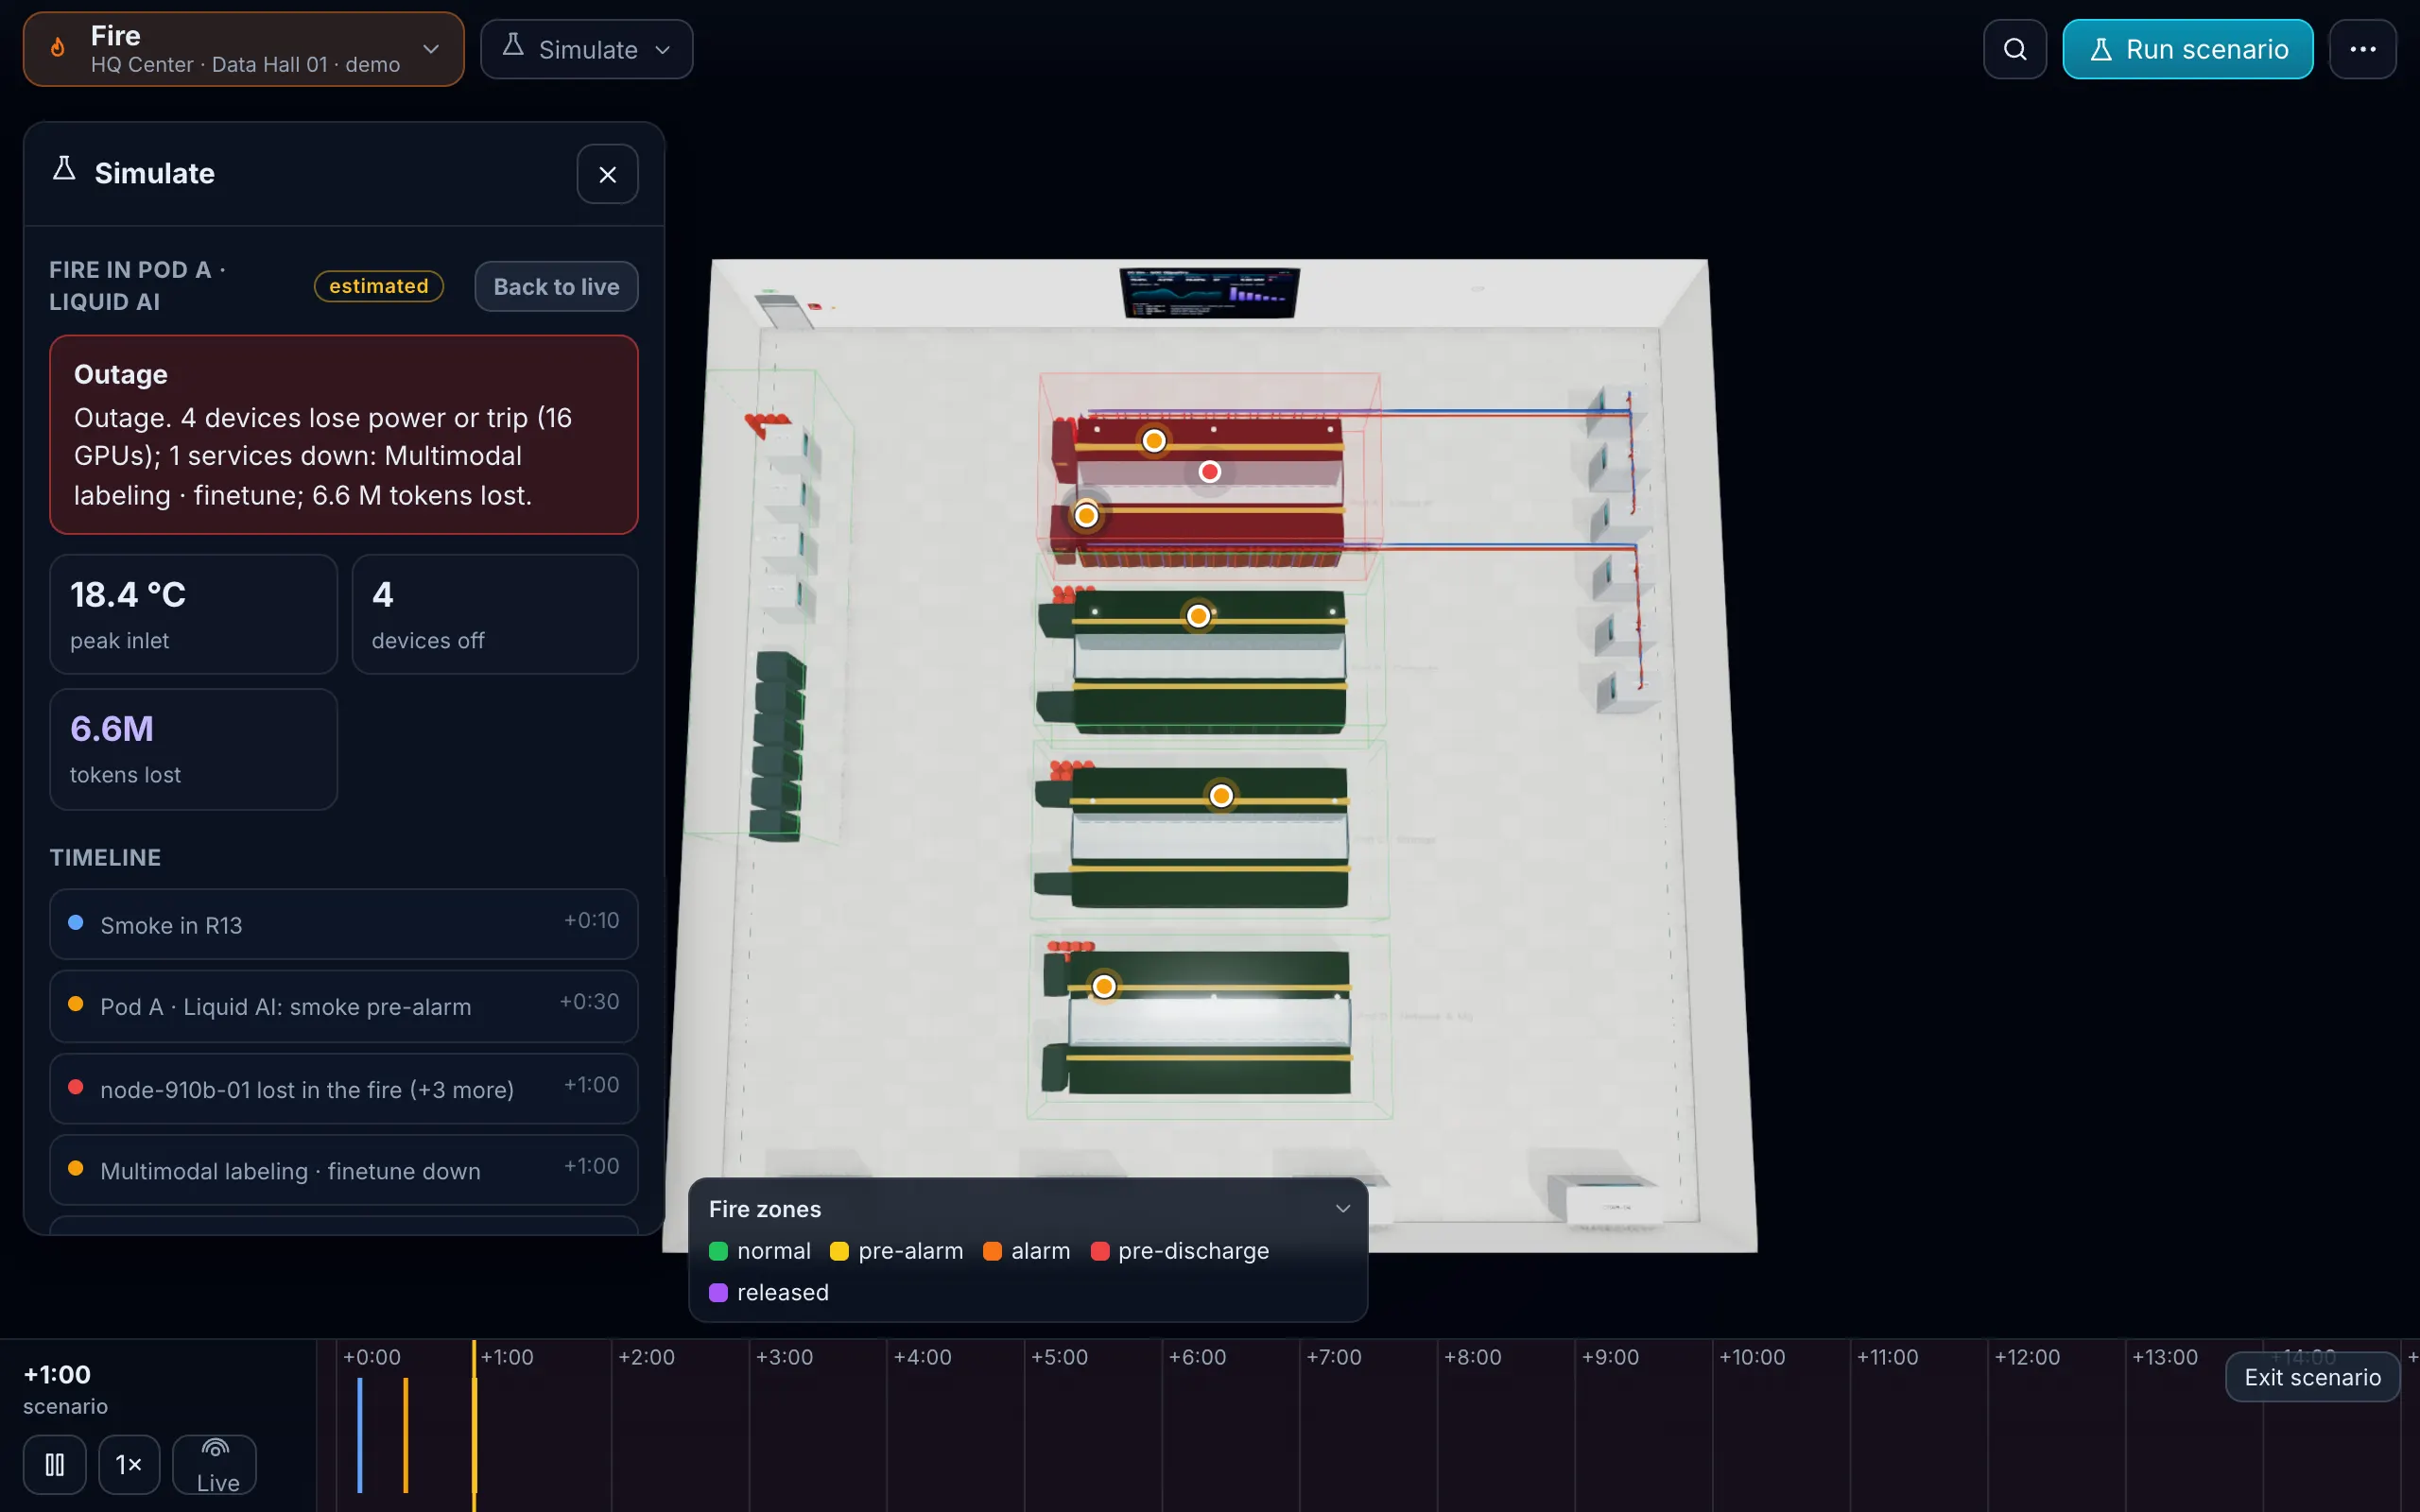
What you see: detection zones by state, detectors, suppression cylinders.
What-if: smoke in a zone, then an early-warning alert, alarm, HVAC interlock, agent release and EPO, as a timeline with the racks and services in the zone listed. Fire is a modelled layer here, not just an alarm input: you see the sequence, not only a red icon.
From the sheet: zones are assumed (one zone per room) until you add them; the import report says so.
Power: “Lose feed A at peak. Who goes dark?”
What you see (3D): rack kW columns, PDU strips coloured by load, power flow along the power cords.
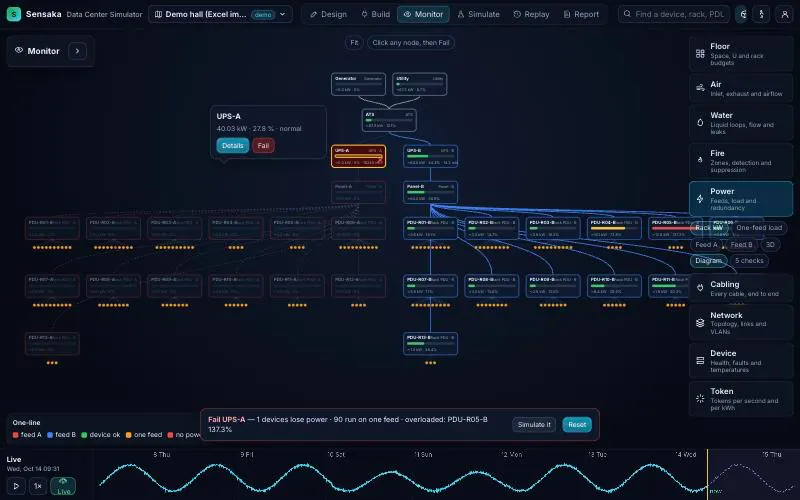
What you see (Diagram): an auto-built one-line (utility, generator and ATS, UPS, panel, PDU, device PSU) with A and B paths in colour, load % on every node and UPS runtime: your runtime_min or battery_kwh from the sheet first, then the catalog, otherwise estimated and labelled.
What-if: click any node, press Fail, and see what goes dark, what survives on one feed, which services stop and what overloads. Simulate it replays the failure through the full model: batteries, generator start, breaker curves, thermal transients, tokens lost.
Checks: any node over 80 % of its rating; per-phase load against 80 % and phase imbalance above 15 % (when the sheets give phases); single-corded or same-feed devices; UPS runtime below 5 minutes at current load.
From the sheet: Power (name, type, rating, fed_from, feed, rack, voltage, phases, phase, runtime_min, battery_kwh, model) and Cables of type power, or the power_cords shortcut (A, B or AB) on Devices.
Rack power capacity planning without a tool means a spreadsheet of nameplate watts and a guess at derating. Here the Devices sheet gives per-rack kW from the catalog, the Power sheet gives breaker and PDU load, and the 80 % rule is checked for you. UPS failure impact analysis is one click: fail the UPS, read the list of orphaned devices, stopped services and overloaded PDUs. Try the rack power calculator or read UPS failure impact analysis in 20 minutes.
Are the temperatures real?
Readings you import are real values from your room. Anything the model projects, such as minutes to threshold, the heat map between sensors or runtime without a UPS reading, carries an "estimated" tag.
Do I need a raised floor or a BMS?
No. The Racks and Cooling sheets are enough to start. Sensor history can be added as a Readings sheet today; live BMS and sensor connectors are on the roadmap.
Can it model 2N and N+1?
Yes. Feeds A and B, an ATS built from fed_from lists, generators and UPS modules; the N−1 audit in Design mode and the Fail what-if both use the same chain.
Does it check phase balance?
Yes, when your sheets say which phase each cable or power item is on (template v1.1). Every three-phase node is checked against 80 % per phase, and an imbalance above 15 % is flagged. Without phase data the import report says phase balance was not checked.
Is the fire layer a compliance tool?
It shows the sequence and the affected racks and services. It is not a substitute for a fire engineer's design or an authority's approval.
Pricing that fits a 10-rack room
Design
from $490 per project, one-time
Plan a room or a new row; three months per project. The AI design assistant comes at no extra cost when it ships.
Monitor
$5 per rack per month, min $49
The twin of a running room, with what-if and reports.
Partner
30 % margin
For integrators, MSPs and consultants.
One Excel file. Your room in 3D.
Download the import template (v1.3, nine sheets, only Devices required) and the filled example from our demo hall. No form, no email needed, no macros in the files.
Fill in the Devices sheet and send it with your walkthrough request; we import it on the call. What each sheet does